Moroccan vs Cypriot In Labor Force | Age 25-29
COMPARE
Moroccan
Cypriot
In Labor Force | Age 25-29
In Labor Force | Age 25-29 Comparison
Moroccans
Cypriots
84.5%
IN LABOR FORCE | AGE 25-29
32.6/ 100
METRIC RATING
189th/ 347
METRIC RANK
85.8%
IN LABOR FORCE | AGE 25-29
99.9/ 100
METRIC RATING
35th/ 347
METRIC RANK
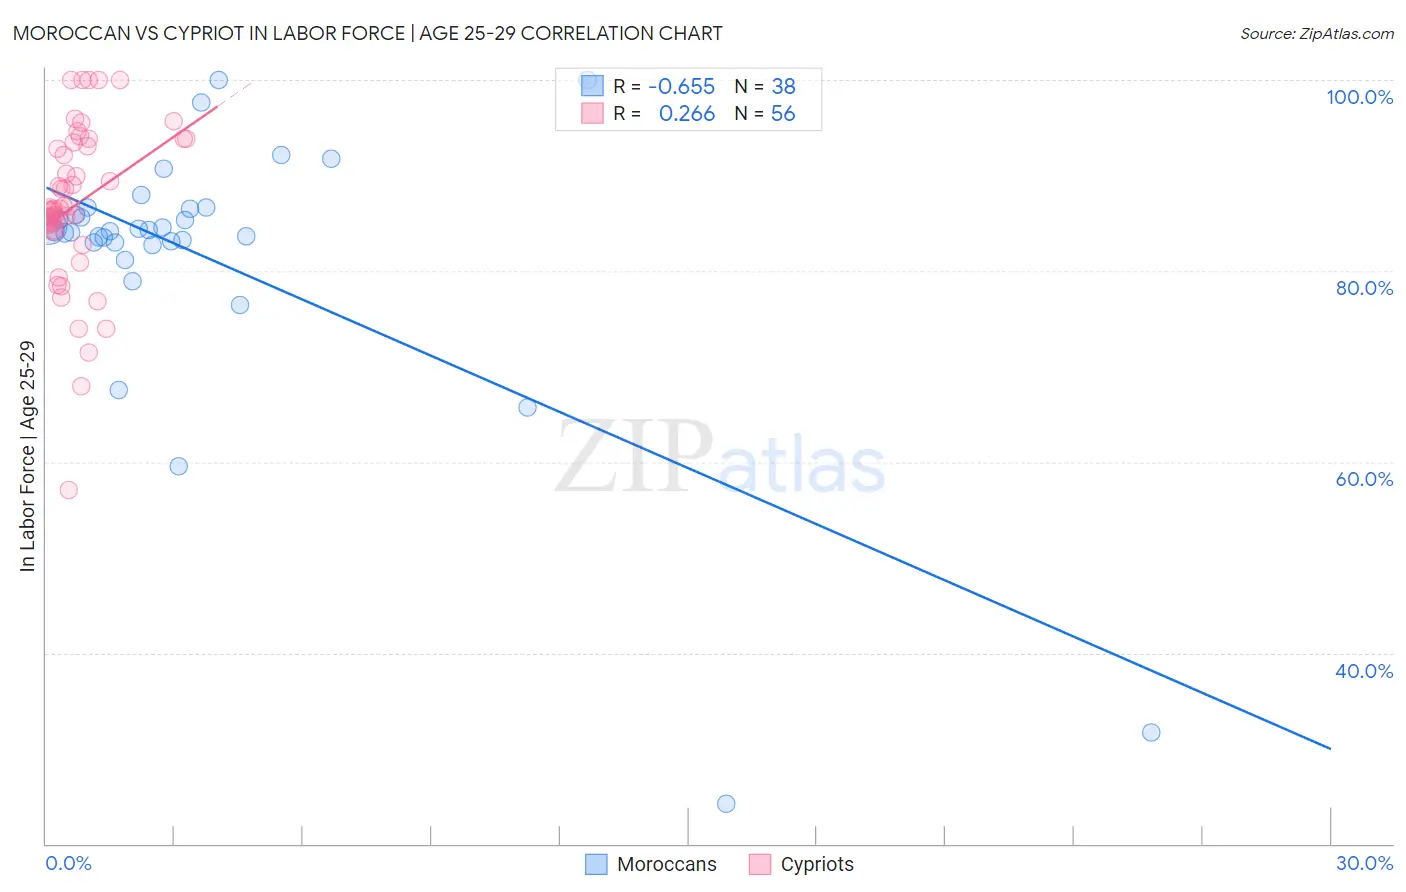
Moroccan vs Cypriot In Labor Force | Age 25-29 Correlation Chart
The statistical analysis conducted on geographies consisting of 201,777,883 people shows a significant negative correlation between the proportion of Moroccans and labor force participation rate among population between the ages 25 and 29 in the United States with a correlation coefficient (R) of -0.655 and weighted average of 84.5%. Similarly, the statistical analysis conducted on geographies consisting of 61,853,224 people shows a weak positive correlation between the proportion of Cypriots and labor force participation rate among population between the ages 25 and 29 in the United States with a correlation coefficient (R) of 0.266 and weighted average of 85.8%, a difference of 1.5%.
In Labor Force | Age 25-29 Correlation Summary
| Measurement | Moroccan | Cypriot |
| Minimum | 24.2% | 57.1% |
| Maximum | 100.0% | 100.0% |
| Range | 75.8% | 42.9% |
| Mean | 81.2% | 86.9% |
| Median | 84.2% | 86.5% |
| Interquartile 25% (IQ1) | 83.0% | 84.6% |
| Interquartile 75% (IQ3) | 86.5% | 93.3% |
| Interquartile Range (IQR) | 3.5% | 8.7% |
| Standard Deviation (Sample) | 14.9% | 8.4% |
| Standard Deviation (Population) | 14.7% | 8.3% |
Similar Demographics by In Labor Force | Age 25-29
Demographics Similar to Moroccans by In Labor Force | Age 25-29
In terms of in labor force | age 25-29, the demographic groups most similar to Moroccans are Immigrants from Ukraine (84.5%, a difference of 0.010%), Welsh (84.5%, a difference of 0.010%), Immigrants from Belgium (84.6%, a difference of 0.020%), Immigrants from Portugal (84.6%, a difference of 0.020%), and Zimbabwean (84.5%, a difference of 0.030%).
| Demographics | Rating | Rank | In Labor Force | Age 25-29 |
| Europeans | 40.3 /100 | #182 | Average 84.6% |
| Scottish | 40.1 /100 | #183 | Average 84.6% |
| Immigrants | Kuwait | 38.2 /100 | #184 | Fair 84.6% |
| Immigrants | Denmark | 37.0 /100 | #185 | Fair 84.6% |
| Immigrants | Belgium | 35.0 /100 | #186 | Fair 84.6% |
| Immigrants | Portugal | 34.7 /100 | #187 | Fair 84.6% |
| Immigrants | Ukraine | 33.7 /100 | #188 | Fair 84.5% |
| Moroccans | 32.6 /100 | #189 | Fair 84.5% |
| Welsh | 31.1 /100 | #190 | Fair 84.5% |
| Zimbabweans | 28.7 /100 | #191 | Fair 84.5% |
| English | 25.8 /100 | #192 | Fair 84.5% |
| South American Indians | 25.0 /100 | #193 | Fair 84.5% |
| Portuguese | 21.2 /100 | #194 | Fair 84.4% |
| Immigrants | Israel | 20.8 /100 | #195 | Fair 84.4% |
| Immigrants | South Eastern Asia | 19.5 /100 | #196 | Poor 84.4% |
Demographics Similar to Cypriots by In Labor Force | Age 25-29
In terms of in labor force | age 25-29, the demographic groups most similar to Cypriots are Immigrants from Nepal (85.8%, a difference of 0.0%), Lithuanian (85.8%, a difference of 0.010%), Polish (85.8%, a difference of 0.030%), German Russian (85.8%, a difference of 0.040%), and Slovak (85.8%, a difference of 0.040%).
| Demographics | Rating | Rank | In Labor Force | Age 25-29 |
| Ugandans | 100.0 /100 | #28 | Exceptional 85.9% |
| Immigrants | Liberia | 100.0 /100 | #29 | Exceptional 85.9% |
| Immigrants | Serbia | 100.0 /100 | #30 | Exceptional 85.9% |
| German Russians | 100.0 /100 | #31 | Exceptional 85.8% |
| Slovaks | 100.0 /100 | #32 | Exceptional 85.8% |
| Immigrants | Bulgaria | 100.0 /100 | #33 | Exceptional 85.8% |
| Lithuanians | 99.9 /100 | #34 | Exceptional 85.8% |
| Cypriots | 99.9 /100 | #35 | Exceptional 85.8% |
| Immigrants | Nepal | 99.9 /100 | #36 | Exceptional 85.8% |
| Poles | 99.9 /100 | #37 | Exceptional 85.8% |
| Sierra Leoneans | 99.9 /100 | #38 | Exceptional 85.8% |
| Croatians | 99.9 /100 | #39 | Exceptional 85.8% |
| Immigrants | Albania | 99.9 /100 | #40 | Exceptional 85.7% |
| Immigrants | Greece | 99.9 /100 | #41 | Exceptional 85.7% |
| Immigrants | Eritrea | 99.9 /100 | #42 | Exceptional 85.7% |