Trinidadian and Tobagonian vs Syrian In Labor Force | Age 25-29
COMPARE
Trinidadian and Tobagonian
Syrian
In Labor Force | Age 25-29
In Labor Force | Age 25-29 Comparison
Trinidadians and Tobagonians
Syrians
83.9%
IN LABOR FORCE | AGE 25-29
0.7/ 100
METRIC RATING
240th/ 347
METRIC RANK
84.8%
IN LABOR FORCE | AGE 25-29
76.5/ 100
METRIC RATING
134th/ 347
METRIC RANK
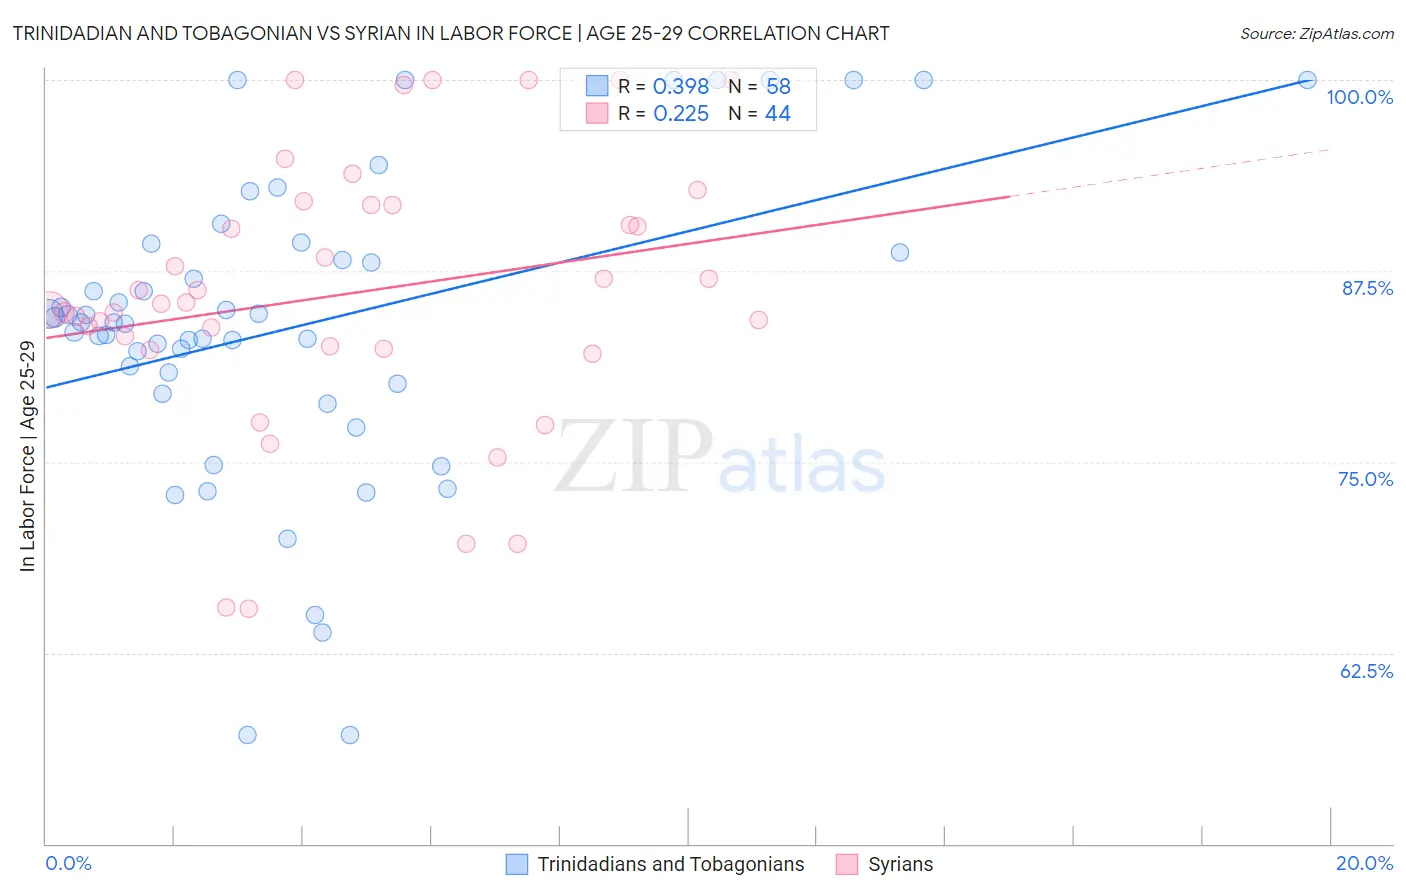
Trinidadian and Tobagonian vs Syrian In Labor Force | Age 25-29 Correlation Chart
The statistical analysis conducted on geographies consisting of 219,834,546 people shows a mild positive correlation between the proportion of Trinidadians and Tobagonians and labor force participation rate among population between the ages 25 and 29 in the United States with a correlation coefficient (R) of 0.398 and weighted average of 83.9%. Similarly, the statistical analysis conducted on geographies consisting of 266,239,805 people shows a weak positive correlation between the proportion of Syrians and labor force participation rate among population between the ages 25 and 29 in the United States with a correlation coefficient (R) of 0.225 and weighted average of 84.8%, a difference of 1.1%.
In Labor Force | Age 25-29 Correlation Summary
| Measurement | Trinidadian and Tobagonian | Syrian |
| Minimum | 57.1% | 65.4% |
| Maximum | 100.0% | 100.0% |
| Range | 42.9% | 34.6% |
| Mean | 83.9% | 86.0% |
| Median | 84.2% | 85.4% |
| Interquartile 25% (IQ1) | 80.1% | 82.5% |
| Interquartile 75% (IQ3) | 88.7% | 91.8% |
| Interquartile Range (IQR) | 8.6% | 9.3% |
| Standard Deviation (Sample) | 10.0% | 8.8% |
| Standard Deviation (Population) | 9.9% | 8.7% |
Similar Demographics by In Labor Force | Age 25-29
Demographics Similar to Trinidadians and Tobagonians by In Labor Force | Age 25-29
In terms of in labor force | age 25-29, the demographic groups most similar to Trinidadians and Tobagonians are Jamaican (83.9%, a difference of 0.0%), Immigrants from Uzbekistan (83.9%, a difference of 0.010%), Alsatian (83.9%, a difference of 0.020%), Iraqi (83.9%, a difference of 0.040%), and Guamanian/Chamorro (83.9%, a difference of 0.040%).
| Demographics | Rating | Rank | In Labor Force | Age 25-29 |
| Immigrants | Western Asia | 2.7 /100 | #233 | Tragic 84.1% |
| Barbadians | 1.0 /100 | #234 | Tragic 83.9% |
| Iraqis | 0.9 /100 | #235 | Tragic 83.9% |
| Guamanians/Chamorros | 0.9 /100 | #236 | Tragic 83.9% |
| Immigrants | Immigrants | 0.9 /100 | #237 | Tragic 83.9% |
| Immigrants | Uzbekistan | 0.8 /100 | #238 | Tragic 83.9% |
| Jamaicans | 0.8 /100 | #239 | Tragic 83.9% |
| Trinidadians and Tobagonians | 0.7 /100 | #240 | Tragic 83.9% |
| Alsatians | 0.7 /100 | #241 | Tragic 83.9% |
| U.S. Virgin Islanders | 0.6 /100 | #242 | Tragic 83.8% |
| Salvadorans | 0.5 /100 | #243 | Tragic 83.8% |
| Immigrants | Jamaica | 0.4 /100 | #244 | Tragic 83.8% |
| Iroquois | 0.4 /100 | #245 | Tragic 83.8% |
| Cree | 0.3 /100 | #246 | Tragic 83.8% |
| Immigrants | El Salvador | 0.3 /100 | #247 | Tragic 83.7% |
Demographics Similar to Syrians by In Labor Force | Age 25-29
In terms of in labor force | age 25-29, the demographic groups most similar to Syrians are Immigrants from Hungary (84.8%, a difference of 0.0%), Romanian (84.8%, a difference of 0.010%), Asian (84.8%, a difference of 0.010%), Bhutanese (84.8%, a difference of 0.010%), and Iranian (84.8%, a difference of 0.020%).
| Demographics | Rating | Rank | In Labor Force | Age 25-29 |
| Immigrants | Uruguay | 84.0 /100 | #127 | Excellent 84.9% |
| Australians | 83.6 /100 | #128 | Excellent 84.9% |
| Immigrants | Russia | 81.6 /100 | #129 | Excellent 84.9% |
| Northern Europeans | 81.3 /100 | #130 | Excellent 84.9% |
| Iranians | 78.1 /100 | #131 | Good 84.8% |
| Romanians | 77.7 /100 | #132 | Good 84.8% |
| Asians | 77.7 /100 | #133 | Good 84.8% |
| Syrians | 76.5 /100 | #134 | Good 84.8% |
| Immigrants | Hungary | 76.4 /100 | #135 | Good 84.8% |
| Bhutanese | 76.0 /100 | #136 | Good 84.8% |
| Immigrants | Canada | 73.5 /100 | #137 | Good 84.8% |
| Armenians | 72.7 /100 | #138 | Good 84.8% |
| Immigrants | Eastern Asia | 72.6 /100 | #139 | Good 84.8% |
| Immigrants | North America | 72.1 /100 | #140 | Good 84.8% |
| Danes | 71.9 /100 | #141 | Good 84.8% |