Immigrants from Eastern Europe vs Immigrants from Cabo Verde In Labor Force | Age 35-44
COMPARE
Immigrants from Eastern Europe
Immigrants from Cabo Verde
In Labor Force | Age 35-44
In Labor Force | Age 35-44 Comparison
Immigrants from Eastern Europe
Immigrants from Cabo Verde
84.9%
IN LABOR FORCE | AGE 35-44
98.3/ 100
METRIC RATING
81st/ 347
METRIC RANK
86.2%
IN LABOR FORCE | AGE 35-44
100.0/ 100
METRIC RATING
4th/ 347
METRIC RANK
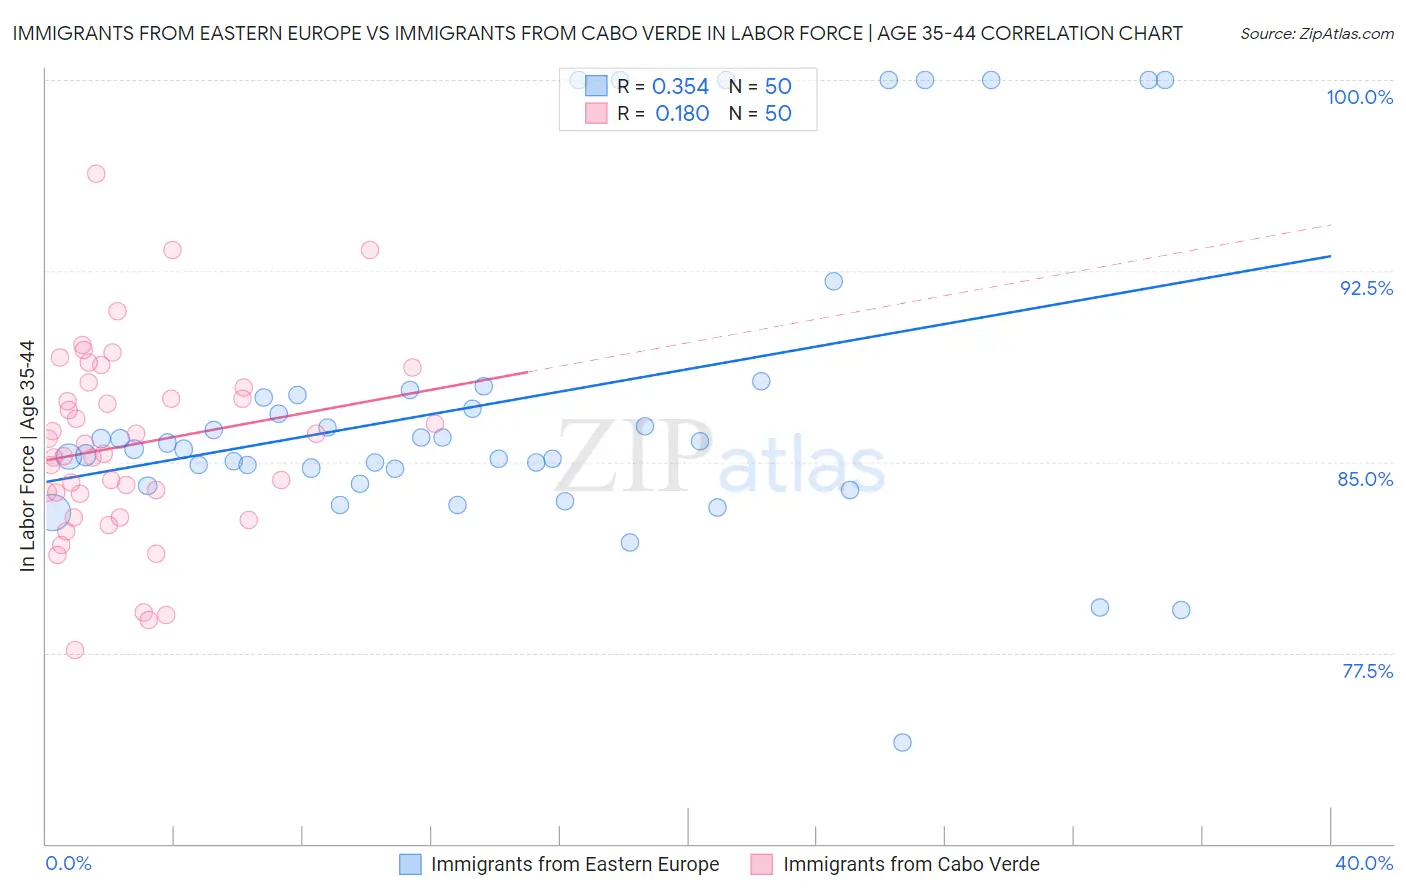
Immigrants from Eastern Europe vs Immigrants from Cabo Verde In Labor Force | Age 35-44 Correlation Chart
The statistical analysis conducted on geographies consisting of 475,561,488 people shows a mild positive correlation between the proportion of Immigrants from Eastern Europe and labor force participation rate among population between the ages 35 and 44 in the United States with a correlation coefficient (R) of 0.354 and weighted average of 84.9%. Similarly, the statistical analysis conducted on geographies consisting of 38,133,227 people shows a poor positive correlation between the proportion of Immigrants from Cabo Verde and labor force participation rate among population between the ages 35 and 44 in the United States with a correlation coefficient (R) of 0.180 and weighted average of 86.2%, a difference of 1.5%.
In Labor Force | Age 35-44 Correlation Summary
| Measurement | Immigrants from Eastern Europe | Immigrants from Cabo Verde |
| Minimum | 74.0% | 77.6% |
| Maximum | 100.0% | 96.3% |
| Range | 26.0% | 18.7% |
| Mean | 87.4% | 85.7% |
| Median | 85.6% | 85.5% |
| Interquartile 25% (IQ1) | 84.7% | 83.8% |
| Interquartile 75% (IQ3) | 87.6% | 87.9% |
| Interquartile Range (IQR) | 2.9% | 4.1% |
| Standard Deviation (Sample) | 6.1% | 3.8% |
| Standard Deviation (Population) | 6.1% | 3.7% |
Similar Demographics by In Labor Force | Age 35-44
Demographics Similar to Immigrants from Eastern Europe by In Labor Force | Age 35-44
In terms of in labor force | age 35-44, the demographic groups most similar to Immigrants from Eastern Europe are Peruvian (84.9%, a difference of 0.0%), Immigrants from Colombia (84.9%, a difference of 0.0%), Immigrants from Africa (84.9%, a difference of 0.010%), Immigrants from Sudan (84.9%, a difference of 0.020%), and Immigrants from Turkey (84.9%, a difference of 0.030%).
| Demographics | Rating | Rank | In Labor Force | Age 35-44 |
| Colombians | 98.8 /100 | #74 | Exceptional 85.0% |
| Immigrants | South Central Asia | 98.7 /100 | #75 | Exceptional 85.0% |
| Immigrants | Cuba | 98.6 /100 | #76 | Exceptional 84.9% |
| Immigrants | Turkey | 98.6 /100 | #77 | Exceptional 84.9% |
| Immigrants | Africa | 98.4 /100 | #78 | Exceptional 84.9% |
| Peruvians | 98.3 /100 | #79 | Exceptional 84.9% |
| Immigrants | Colombia | 98.3 /100 | #80 | Exceptional 84.9% |
| Immigrants | Eastern Europe | 98.3 /100 | #81 | Exceptional 84.9% |
| Immigrants | Sudan | 98.1 /100 | #82 | Exceptional 84.9% |
| Senegalese | 97.8 /100 | #83 | Exceptional 84.9% |
| Immigrants | Peru | 97.8 /100 | #84 | Exceptional 84.9% |
| Immigrants | Middle Africa | 97.8 /100 | #85 | Exceptional 84.9% |
| Greeks | 97.8 /100 | #86 | Exceptional 84.9% |
| Belgians | 97.7 /100 | #87 | Exceptional 84.9% |
| Yugoslavians | 97.7 /100 | #88 | Exceptional 84.9% |
Demographics Similar to Immigrants from Cabo Verde by In Labor Force | Age 35-44
In terms of in labor force | age 35-44, the demographic groups most similar to Immigrants from Cabo Verde are Immigrants from Bolivia (86.2%, a difference of 0.030%), Zimbabwean (86.1%, a difference of 0.13%), Bolivian (86.1%, a difference of 0.14%), Immigrants from Sierra Leone (86.1%, a difference of 0.18%), and Luxembourger (86.4%, a difference of 0.22%).
| Demographics | Rating | Rank | In Labor Force | Age 35-44 |
| Sierra Leoneans | 100.0 /100 | #1 | Exceptional 86.4% |
| Luxembourgers | 100.0 /100 | #2 | Exceptional 86.4% |
| Immigrants | Bolivia | 100.0 /100 | #3 | Exceptional 86.2% |
| Immigrants | Cabo Verde | 100.0 /100 | #4 | Exceptional 86.2% |
| Zimbabweans | 100.0 /100 | #5 | Exceptional 86.1% |
| Bolivians | 100.0 /100 | #6 | Exceptional 86.1% |
| Immigrants | Sierra Leone | 100.0 /100 | #7 | Exceptional 86.1% |
| Immigrants | Ethiopia | 100.0 /100 | #8 | Exceptional 85.9% |
| Ethiopians | 100.0 /100 | #9 | Exceptional 85.9% |
| Cape Verdeans | 100.0 /100 | #10 | Exceptional 85.8% |
| Immigrants | Cameroon | 100.0 /100 | #11 | Exceptional 85.8% |
| Liberians | 100.0 /100 | #12 | Exceptional 85.7% |
| Somalis | 100.0 /100 | #13 | Exceptional 85.6% |
| Immigrants | Somalia | 100.0 /100 | #14 | Exceptional 85.6% |
| Norwegians | 100.0 /100 | #15 | Exceptional 85.6% |