Belgian vs Senegalese In Labor Force | Age 25-29
COMPARE
Belgian
Senegalese
In Labor Force | Age 25-29
In Labor Force | Age 25-29 Comparison
Belgians
Senegalese
85.5%
IN LABOR FORCE | AGE 25-29
99.7/ 100
METRIC RATING
53rd/ 347
METRIC RANK
85.0%
IN LABOR FORCE | AGE 25-29
90.9/ 100
METRIC RATING
112th/ 347
METRIC RANK
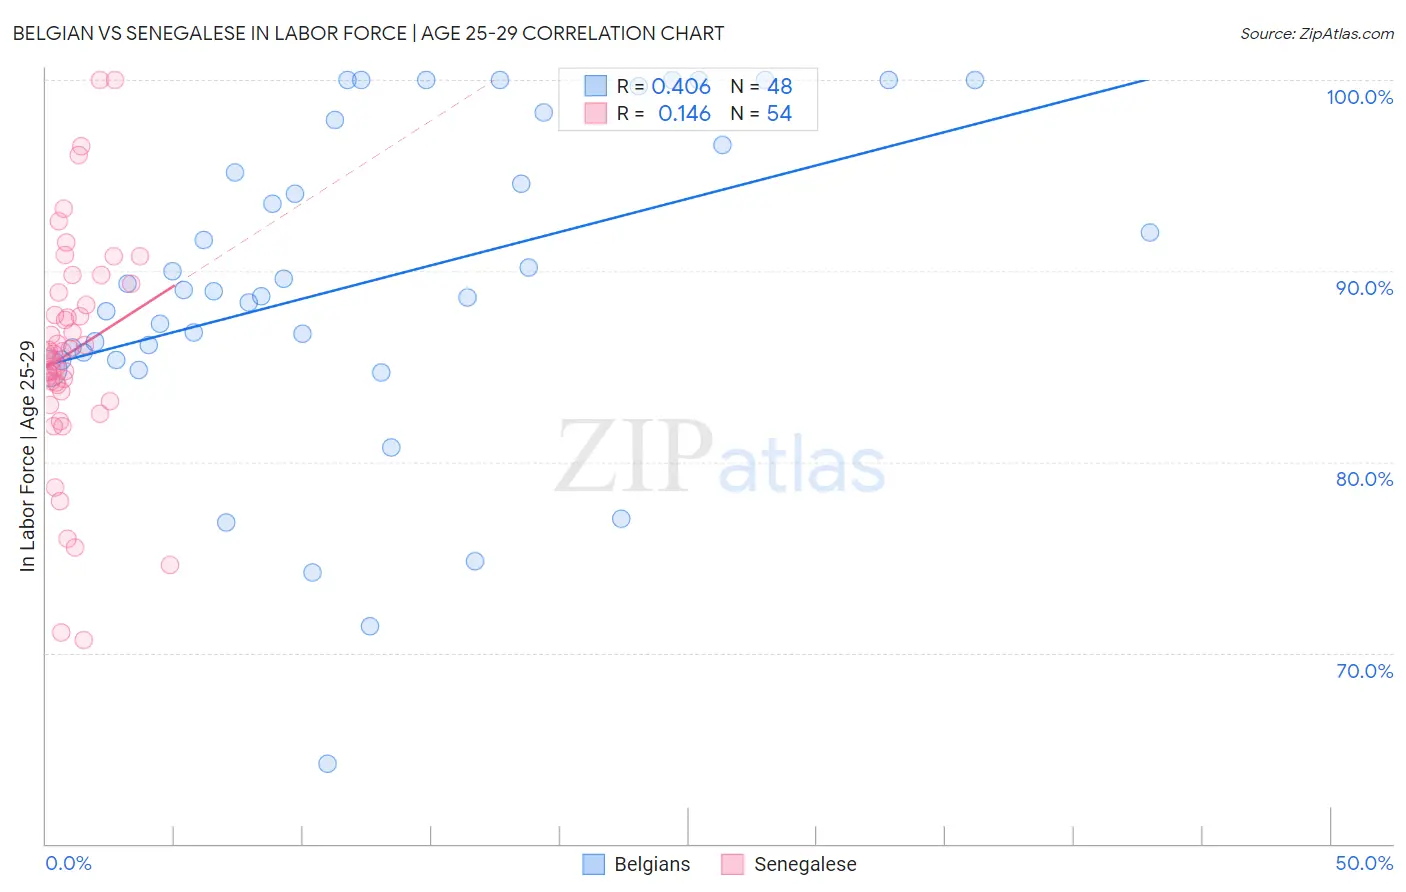
Belgian vs Senegalese In Labor Force | Age 25-29 Correlation Chart
The statistical analysis conducted on geographies consisting of 355,849,084 people shows a moderate positive correlation between the proportion of Belgians and labor force participation rate among population between the ages 25 and 29 in the United States with a correlation coefficient (R) of 0.406 and weighted average of 85.5%. Similarly, the statistical analysis conducted on geographies consisting of 78,132,708 people shows a poor positive correlation between the proportion of Senegalese and labor force participation rate among population between the ages 25 and 29 in the United States with a correlation coefficient (R) of 0.146 and weighted average of 85.0%, a difference of 0.63%.
In Labor Force | Age 25-29 Correlation Summary
| Measurement | Belgian | Senegalese |
| Minimum | 64.2% | 70.7% |
| Maximum | 100.0% | 100.0% |
| Range | 35.8% | 29.3% |
| Mean | 89.4% | 85.8% |
| Median | 89.0% | 85.7% |
| Interquartile 25% (IQ1) | 85.5% | 83.7% |
| Interquartile 75% (IQ3) | 97.3% | 88.9% |
| Interquartile Range (IQR) | 11.7% | 5.2% |
| Standard Deviation (Sample) | 8.5% | 6.0% |
| Standard Deviation (Population) | 8.4% | 5.9% |
Similar Demographics by In Labor Force | Age 25-29
Demographics Similar to Belgians by In Labor Force | Age 25-29
In terms of in labor force | age 25-29, the demographic groups most similar to Belgians are Albanian (85.5%, a difference of 0.0%), Immigrants from Brazil (85.5%, a difference of 0.010%), Immigrants from Poland (85.6%, a difference of 0.030%), Eastern European (85.5%, a difference of 0.040%), and Yugoslavian (85.6%, a difference of 0.050%).
| Demographics | Rating | Rank | In Labor Force | Age 25-29 |
| Czechs | 99.8 /100 | #46 | Exceptional 85.6% |
| Turks | 99.8 /100 | #47 | Exceptional 85.6% |
| Italians | 99.8 /100 | #48 | Exceptional 85.6% |
| Swedes | 99.8 /100 | #49 | Exceptional 85.6% |
| Yugoslavians | 99.8 /100 | #50 | Exceptional 85.6% |
| Immigrants | Latvia | 99.8 /100 | #51 | Exceptional 85.6% |
| Immigrants | Poland | 99.7 /100 | #52 | Exceptional 85.6% |
| Belgians | 99.7 /100 | #53 | Exceptional 85.5% |
| Albanians | 99.7 /100 | #54 | Exceptional 85.5% |
| Immigrants | Brazil | 99.7 /100 | #55 | Exceptional 85.5% |
| Eastern Europeans | 99.6 /100 | #56 | Exceptional 85.5% |
| Estonians | 99.6 /100 | #57 | Exceptional 85.5% |
| Greeks | 99.6 /100 | #58 | Exceptional 85.5% |
| Immigrants | Morocco | 99.5 /100 | #59 | Exceptional 85.5% |
| Thais | 99.5 /100 | #60 | Exceptional 85.5% |
Demographics Similar to Senegalese by In Labor Force | Age 25-29
In terms of in labor force | age 25-29, the demographic groups most similar to Senegalese are New Zealander (85.0%, a difference of 0.010%), Immigrants from Middle Africa (85.0%, a difference of 0.010%), Irish (85.0%, a difference of 0.010%), Immigrants from Malaysia (85.0%, a difference of 0.010%), and Immigrants from Austria (85.0%, a difference of 0.020%).
| Demographics | Rating | Rank | In Labor Force | Age 25-29 |
| Immigrants | Hong Kong | 92.8 /100 | #105 | Exceptional 85.0% |
| Czechoslovakians | 92.6 /100 | #106 | Exceptional 85.0% |
| Immigrants | Southern Europe | 92.3 /100 | #107 | Exceptional 85.0% |
| Immigrants | Austria | 91.9 /100 | #108 | Exceptional 85.0% |
| Costa Ricans | 91.9 /100 | #109 | Exceptional 85.0% |
| New Zealanders | 91.5 /100 | #110 | Exceptional 85.0% |
| Immigrants | Middle Africa | 91.4 /100 | #111 | Exceptional 85.0% |
| Senegalese | 90.9 /100 | #112 | Exceptional 85.0% |
| Irish | 90.6 /100 | #113 | Exceptional 85.0% |
| Immigrants | Malaysia | 90.4 /100 | #114 | Exceptional 85.0% |
| South Africans | 88.9 /100 | #115 | Excellent 85.0% |
| Chileans | 88.8 /100 | #116 | Excellent 85.0% |
| Immigrants | Belarus | 88.0 /100 | #117 | Excellent 85.0% |
| Finns | 87.8 /100 | #118 | Excellent 85.0% |
| Filipinos | 87.1 /100 | #119 | Excellent 84.9% |