Basque vs Estonian In Labor Force | Age > 16
COMPARE
Basque
Estonian
In Labor Force | Age > 16
In Labor Force | Age > 16 Comparison
Basques
Estonians
64.2%
IN LABOR FORCE | AGE > 16
0.7/ 100
METRIC RATING
261st/ 347
METRIC RANK
64.8%
IN LABOR FORCE | AGE > 16
13.1/ 100
METRIC RATING
214th/ 347
METRIC RANK
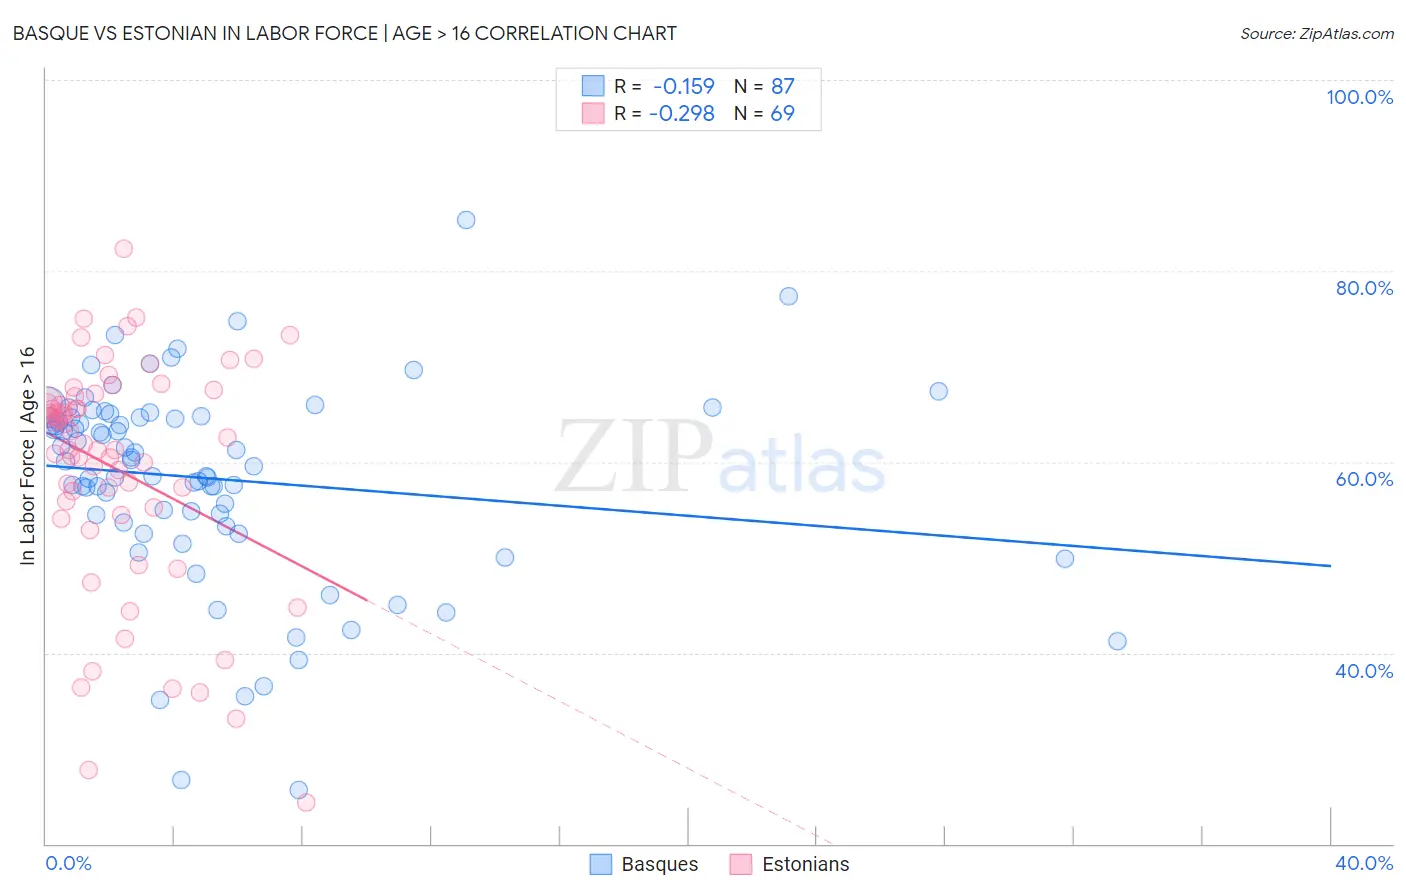
Basque vs Estonian In Labor Force | Age > 16 Correlation Chart
The statistical analysis conducted on geographies consisting of 165,779,743 people shows a poor negative correlation between the proportion of Basques and labor force participation rate among population ages 16 and over in the United States with a correlation coefficient (R) of -0.159 and weighted average of 64.2%. Similarly, the statistical analysis conducted on geographies consisting of 123,528,478 people shows a weak negative correlation between the proportion of Estonians and labor force participation rate among population ages 16 and over in the United States with a correlation coefficient (R) of -0.298 and weighted average of 64.8%, a difference of 0.87%.
In Labor Force | Age > 16 Correlation Summary
| Measurement | Basque | Estonian |
| Minimum | 25.7% | 24.3% |
| Maximum | 85.4% | 82.3% |
| Range | 59.7% | 58.0% |
| Mean | 58.2% | 59.2% |
| Median | 60.1% | 61.9% |
| Interquartile 25% (IQ1) | 53.6% | 54.8% |
| Interquartile 75% (IQ3) | 64.7% | 66.6% |
| Interquartile Range (IQR) | 11.1% | 11.7% |
| Standard Deviation (Sample) | 10.6% | 12.0% |
| Standard Deviation (Population) | 10.5% | 11.9% |
Similar Demographics by In Labor Force | Age > 16
Demographics Similar to Basques by In Labor Force | Age > 16
In terms of in labor force | age > 16, the demographic groups most similar to Basques are Marshallese (64.2%, a difference of 0.0%), Immigrants from Western Europe (64.2%, a difference of 0.010%), Finnish (64.2%, a difference of 0.010%), Bahamian (64.2%, a difference of 0.030%), and Immigrants from Scotland (64.2%, a difference of 0.040%).
| Demographics | Rating | Rank | In Labor Force | Age > 16 |
| Immigrants | Uzbekistan | 1.4 /100 | #254 | Tragic 64.3% |
| Hispanics or Latinos | 1.1 /100 | #255 | Tragic 64.3% |
| Immigrants | Mexico | 1.0 /100 | #256 | Tragic 64.3% |
| Inupiat | 0.8 /100 | #257 | Tragic 64.3% |
| Immigrants | Scotland | 0.8 /100 | #258 | Tragic 64.2% |
| Immigrants | Western Europe | 0.7 /100 | #259 | Tragic 64.2% |
| Marshallese | 0.7 /100 | #260 | Tragic 64.2% |
| Basques | 0.7 /100 | #261 | Tragic 64.2% |
| Finns | 0.7 /100 | #262 | Tragic 64.2% |
| Bahamians | 0.6 /100 | #263 | Tragic 64.2% |
| Dutch | 0.6 /100 | #264 | Tragic 64.2% |
| Cubans | 0.5 /100 | #265 | Tragic 64.2% |
| Immigrants | England | 0.5 /100 | #266 | Tragic 64.2% |
| Canadians | 0.5 /100 | #267 | Tragic 64.1% |
| Spaniards | 0.5 /100 | #268 | Tragic 64.1% |
Demographics Similar to Estonians by In Labor Force | Age > 16
In terms of in labor force | age > 16, the demographic groups most similar to Estonians are Fijian (64.8%, a difference of 0.020%), Alaskan Athabascan (64.8%, a difference of 0.020%), Maltese (64.8%, a difference of 0.020%), Immigrants from Czechoslovakia (64.8%, a difference of 0.020%), and Immigrants from Denmark (64.8%, a difference of 0.040%).
| Demographics | Rating | Rank | In Labor Force | Age > 16 |
| Immigrants | Latin America | 16.4 /100 | #207 | Poor 64.8% |
| Belizeans | 16.2 /100 | #208 | Poor 64.8% |
| Immigrants | Trinidad and Tobago | 15.6 /100 | #209 | Poor 64.8% |
| Immigrants | Denmark | 14.7 /100 | #210 | Poor 64.8% |
| Fijians | 14.1 /100 | #211 | Poor 64.8% |
| Alaskan Athabascans | 13.9 /100 | #212 | Poor 64.8% |
| Maltese | 13.8 /100 | #213 | Poor 64.8% |
| Estonians | 13.1 /100 | #214 | Poor 64.8% |
| Immigrants | Czechoslovakia | 12.3 /100 | #215 | Poor 64.8% |
| Belgians | 11.4 /100 | #216 | Poor 64.7% |
| U.S. Virgin Islanders | 11.3 /100 | #217 | Poor 64.7% |
| Alsatians | 10.7 /100 | #218 | Poor 64.7% |
| Immigrants | Central America | 10.5 /100 | #219 | Poor 64.7% |
| Alaska Natives | 9.9 /100 | #220 | Tragic 64.7% |
| Immigrants | Micronesia | 9.6 /100 | #221 | Tragic 64.7% |