Nonimmigrants vs Ethiopian In Labor Force | Age 30-34
COMPARE
Nonimmigrants
Ethiopian
In Labor Force | Age 30-34
In Labor Force | Age 30-34 Comparison
Nonimmigrants
Ethiopians
83.5%
IN LABOR FORCE | AGE 30-34
0.0/ 100
METRIC RATING
272nd/ 347
METRIC RANK
86.6%
IN LABOR FORCE | AGE 30-34
100.0/ 100
METRIC RATING
2nd/ 347
METRIC RANK
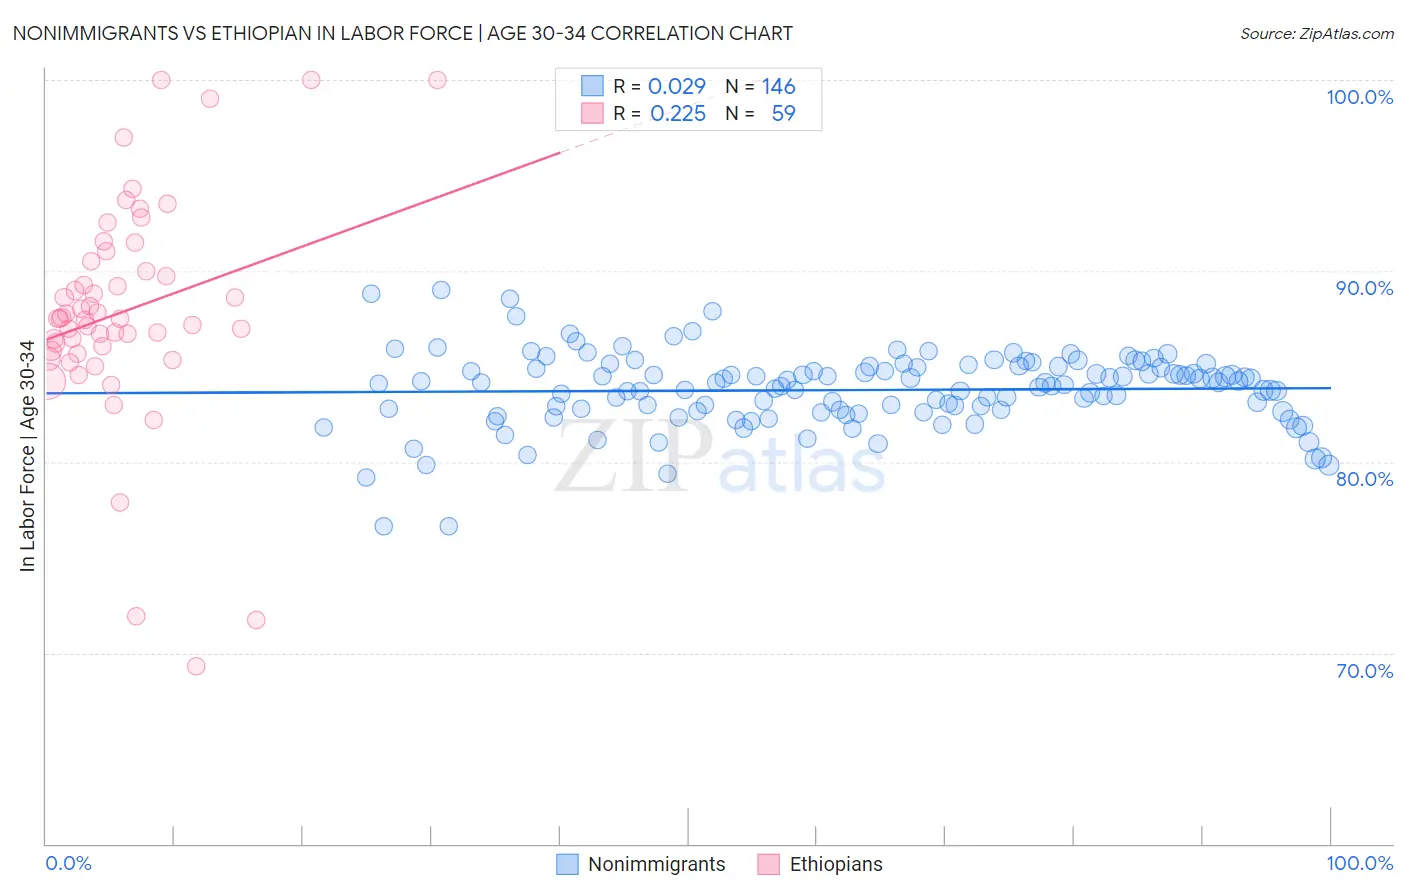
Nonimmigrants vs Ethiopian In Labor Force | Age 30-34 Correlation Chart
The statistical analysis conducted on geographies consisting of 582,736,501 people shows no correlation between the proportion of Nonimmigrants and labor force participation rate among population between the ages 30 and 34 in the United States with a correlation coefficient (R) of 0.029 and weighted average of 83.5%. Similarly, the statistical analysis conducted on geographies consisting of 223,145,375 people shows a weak positive correlation between the proportion of Ethiopians and labor force participation rate among population between the ages 30 and 34 in the United States with a correlation coefficient (R) of 0.225 and weighted average of 86.6%, a difference of 3.6%.
In Labor Force | Age 30-34 Correlation Summary
| Measurement | Nonimmigrants | Ethiopian |
| Minimum | 76.6% | 69.3% |
| Maximum | 89.0% | 100.0% |
| Range | 12.4% | 30.7% |
| Mean | 83.8% | 87.9% |
| Median | 84.1% | 87.5% |
| Interquartile 25% (IQ1) | 82.6% | 85.8% |
| Interquartile 75% (IQ3) | 85.0% | 90.5% |
| Interquartile Range (IQR) | 2.3% | 4.7% |
| Standard Deviation (Sample) | 2.0% | 5.9% |
| Standard Deviation (Population) | 2.0% | 5.8% |
Similar Demographics by In Labor Force | Age 30-34
Demographics Similar to Nonimmigrants by In Labor Force | Age 30-34
In terms of in labor force | age 30-34, the demographic groups most similar to Nonimmigrants are Spanish (83.5%, a difference of 0.0%), Spanish American (83.5%, a difference of 0.020%), Guamanian/Chamorro (83.5%, a difference of 0.050%), Belizean (83.5%, a difference of 0.060%), and Vietnamese (83.6%, a difference of 0.070%).
| Demographics | Rating | Rank | In Labor Force | Age 30-34 |
| Immigrants | Honduras | 0.1 /100 | #265 | Tragic 83.7% |
| Immigrants | Guatemala | 0.1 /100 | #266 | Tragic 83.7% |
| Spaniards | 0.1 /100 | #267 | Tragic 83.6% |
| Immigrants | Bangladesh | 0.1 /100 | #268 | Tragic 83.6% |
| Vietnamese | 0.1 /100 | #269 | Tragic 83.6% |
| Spanish Americans | 0.0 /100 | #270 | Tragic 83.5% |
| Spanish | 0.0 /100 | #271 | Tragic 83.5% |
| Immigrants | Nonimmigrants | 0.0 /100 | #272 | Tragic 83.5% |
| Guamanians/Chamorros | 0.0 /100 | #273 | Tragic 83.5% |
| Belizeans | 0.0 /100 | #274 | Tragic 83.5% |
| Immigrants | Grenada | 0.0 /100 | #275 | Tragic 83.5% |
| Tongans | 0.0 /100 | #276 | Tragic 83.5% |
| Delaware | 0.0 /100 | #277 | Tragic 83.5% |
| Fijians | 0.0 /100 | #278 | Tragic 83.4% |
| Immigrants | Fiji | 0.0 /100 | #279 | Tragic 83.4% |
Demographics Similar to Ethiopians by In Labor Force | Age 30-34
In terms of in labor force | age 30-34, the demographic groups most similar to Ethiopians are Immigrants from Ethiopia (86.6%, a difference of 0.010%), Luxembourger (86.6%, a difference of 0.070%), Liberian (86.4%, a difference of 0.20%), Immigrants from Ireland (86.3%, a difference of 0.35%), and Somali (86.2%, a difference of 0.38%).
| Demographics | Rating | Rank | In Labor Force | Age 30-34 |
| Luxembourgers | 100.0 /100 | #1 | Exceptional 86.6% |
| Ethiopians | 100.0 /100 | #2 | Exceptional 86.6% |
| Immigrants | Ethiopia | 100.0 /100 | #3 | Exceptional 86.6% |
| Liberians | 100.0 /100 | #4 | Exceptional 86.4% |
| Immigrants | Ireland | 100.0 /100 | #5 | Exceptional 86.3% |
| Somalis | 100.0 /100 | #6 | Exceptional 86.2% |
| Immigrants | Bolivia | 100.0 /100 | #7 | Exceptional 86.2% |
| Cambodians | 100.0 /100 | #8 | Exceptional 86.2% |
| Immigrants | Somalia | 100.0 /100 | #9 | Exceptional 86.2% |
| Immigrants | Serbia | 100.0 /100 | #10 | Exceptional 86.2% |
| Carpatho Rusyns | 100.0 /100 | #11 | Exceptional 86.2% |
| Bolivians | 100.0 /100 | #12 | Exceptional 86.1% |
| Immigrants | Croatia | 100.0 /100 | #13 | Exceptional 86.1% |
| Immigrants | Cabo Verde | 100.0 /100 | #14 | Exceptional 86.1% |
| Immigrants | Albania | 100.0 /100 | #15 | Exceptional 86.1% |