Taiwanese vs Ethiopian In Labor Force | Age 30-34
COMPARE
Taiwanese
Ethiopian
In Labor Force | Age 30-34
In Labor Force | Age 30-34 Comparison
Taiwanese
Ethiopians
84.6%
IN LABOR FORCE | AGE 30-34
29.4/ 100
METRIC RATING
188th/ 347
METRIC RANK
86.6%
IN LABOR FORCE | AGE 30-34
100.0/ 100
METRIC RATING
2nd/ 347
METRIC RANK
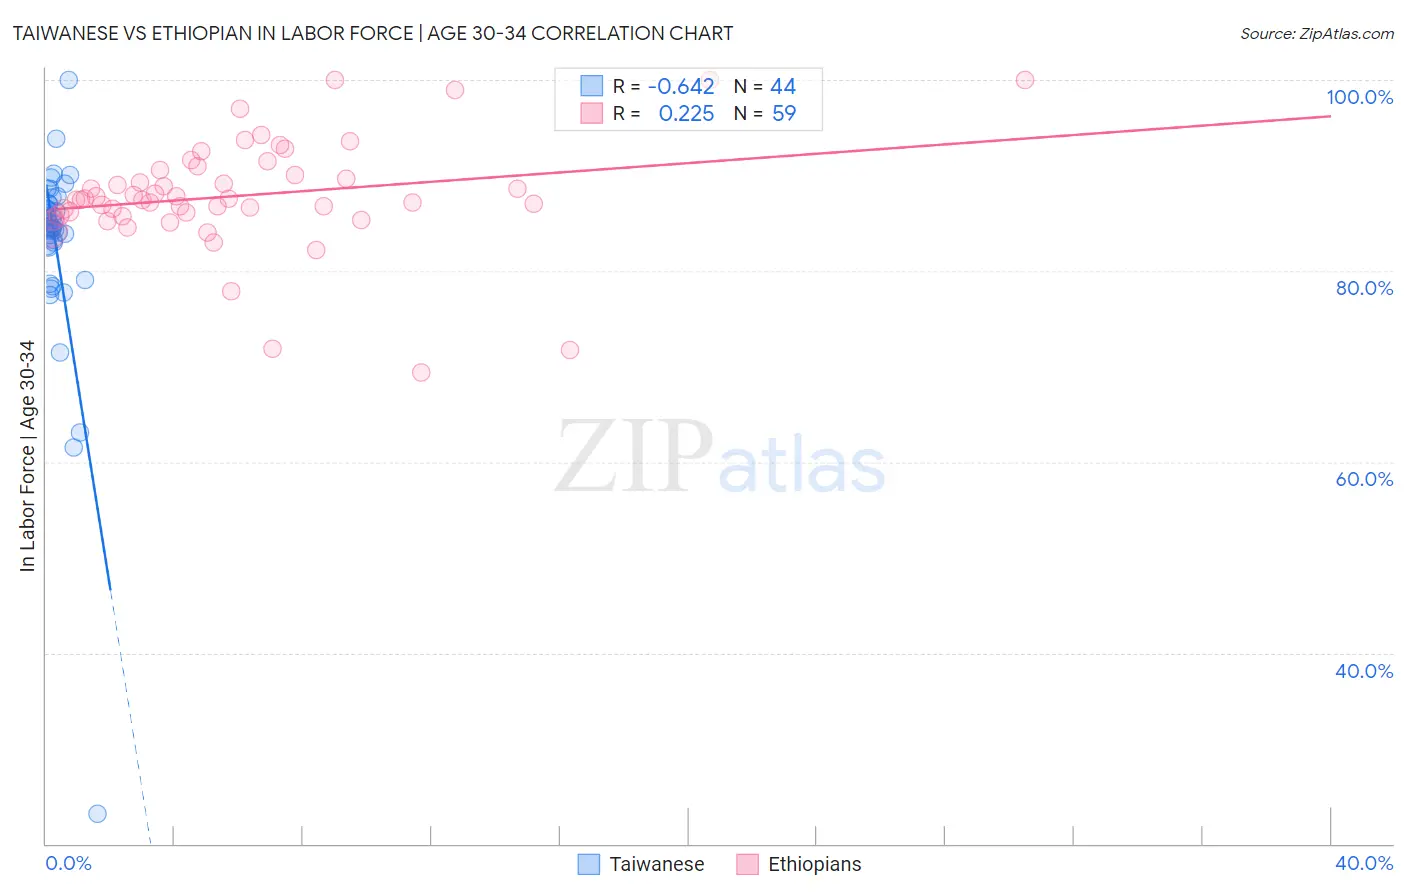
Taiwanese vs Ethiopian In Labor Force | Age 30-34 Correlation Chart
The statistical analysis conducted on geographies consisting of 31,720,118 people shows a significant negative correlation between the proportion of Taiwanese and labor force participation rate among population between the ages 30 and 34 in the United States with a correlation coefficient (R) of -0.642 and weighted average of 84.6%. Similarly, the statistical analysis conducted on geographies consisting of 223,145,375 people shows a weak positive correlation between the proportion of Ethiopians and labor force participation rate among population between the ages 30 and 34 in the United States with a correlation coefficient (R) of 0.225 and weighted average of 86.6%, a difference of 2.4%.
In Labor Force | Age 30-34 Correlation Summary
| Measurement | Taiwanese | Ethiopian |
| Minimum | 23.1% | 69.3% |
| Maximum | 100.0% | 100.0% |
| Range | 76.9% | 30.7% |
| Mean | 82.5% | 87.9% |
| Median | 84.6% | 87.5% |
| Interquartile 25% (IQ1) | 82.5% | 85.8% |
| Interquartile 75% (IQ3) | 87.0% | 90.5% |
| Interquartile Range (IQR) | 4.5% | 4.7% |
| Standard Deviation (Sample) | 11.3% | 5.9% |
| Standard Deviation (Population) | 11.2% | 5.8% |
Similar Demographics by In Labor Force | Age 30-34
Demographics Similar to Taiwanese by In Labor Force | Age 30-34
In terms of in labor force | age 30-34, the demographic groups most similar to Taiwanese are Immigrants from Congo (84.6%, a difference of 0.0%), Costa Rican (84.6%, a difference of 0.0%), Nigerian (84.5%, a difference of 0.0%), Immigrants from Philippines (84.6%, a difference of 0.020%), and Immigrants from North America (84.6%, a difference of 0.030%).
| Demographics | Rating | Rank | In Labor Force | Age 30-34 |
| Moroccans | 40.3 /100 | #181 | Average 84.6% |
| Barbadians | 36.7 /100 | #182 | Fair 84.6% |
| Immigrants | Canada | 35.0 /100 | #183 | Fair 84.6% |
| Immigrants | North America | 33.3 /100 | #184 | Fair 84.6% |
| Immigrants | Philippines | 31.5 /100 | #185 | Fair 84.6% |
| Immigrants | Congo | 29.7 /100 | #186 | Fair 84.6% |
| Costa Ricans | 29.6 /100 | #187 | Fair 84.6% |
| Taiwanese | 29.4 /100 | #188 | Fair 84.6% |
| Nigerians | 28.9 /100 | #189 | Fair 84.5% |
| Immigrants | Zaire | 25.8 /100 | #190 | Fair 84.5% |
| Hungarians | 24.8 /100 | #191 | Fair 84.5% |
| Scandinavians | 24.7 /100 | #192 | Fair 84.5% |
| Immigrants | Costa Rica | 23.9 /100 | #193 | Fair 84.5% |
| Immigrants | Afghanistan | 23.5 /100 | #194 | Fair 84.5% |
| Koreans | 23.2 /100 | #195 | Fair 84.5% |
Demographics Similar to Ethiopians by In Labor Force | Age 30-34
In terms of in labor force | age 30-34, the demographic groups most similar to Ethiopians are Immigrants from Ethiopia (86.6%, a difference of 0.010%), Luxembourger (86.6%, a difference of 0.070%), Liberian (86.4%, a difference of 0.20%), Immigrants from Ireland (86.3%, a difference of 0.35%), and Somali (86.2%, a difference of 0.38%).
| Demographics | Rating | Rank | In Labor Force | Age 30-34 |
| Luxembourgers | 100.0 /100 | #1 | Exceptional 86.6% |
| Ethiopians | 100.0 /100 | #2 | Exceptional 86.6% |
| Immigrants | Ethiopia | 100.0 /100 | #3 | Exceptional 86.6% |
| Liberians | 100.0 /100 | #4 | Exceptional 86.4% |
| Immigrants | Ireland | 100.0 /100 | #5 | Exceptional 86.3% |
| Somalis | 100.0 /100 | #6 | Exceptional 86.2% |
| Immigrants | Bolivia | 100.0 /100 | #7 | Exceptional 86.2% |
| Cambodians | 100.0 /100 | #8 | Exceptional 86.2% |
| Immigrants | Somalia | 100.0 /100 | #9 | Exceptional 86.2% |
| Immigrants | Serbia | 100.0 /100 | #10 | Exceptional 86.2% |
| Carpatho Rusyns | 100.0 /100 | #11 | Exceptional 86.2% |
| Bolivians | 100.0 /100 | #12 | Exceptional 86.1% |
| Immigrants | Croatia | 100.0 /100 | #13 | Exceptional 86.1% |
| Immigrants | Cabo Verde | 100.0 /100 | #14 | Exceptional 86.1% |
| Immigrants | Albania | 100.0 /100 | #15 | Exceptional 86.1% |