Basque vs Ethiopian Single Mother Households
COMPARE
Basque
Ethiopian
Single Mother Households
Single Mother Households Comparison
Basques
Ethiopians
5.7%
SINGLE MOTHER HOUSEHOLDS
96.7/ 100
METRIC RATING
94th/ 347
METRIC RANK
6.5%
SINGLE MOTHER HOUSEHOLDS
26.0/ 100
METRIC RATING
184th/ 347
METRIC RANK
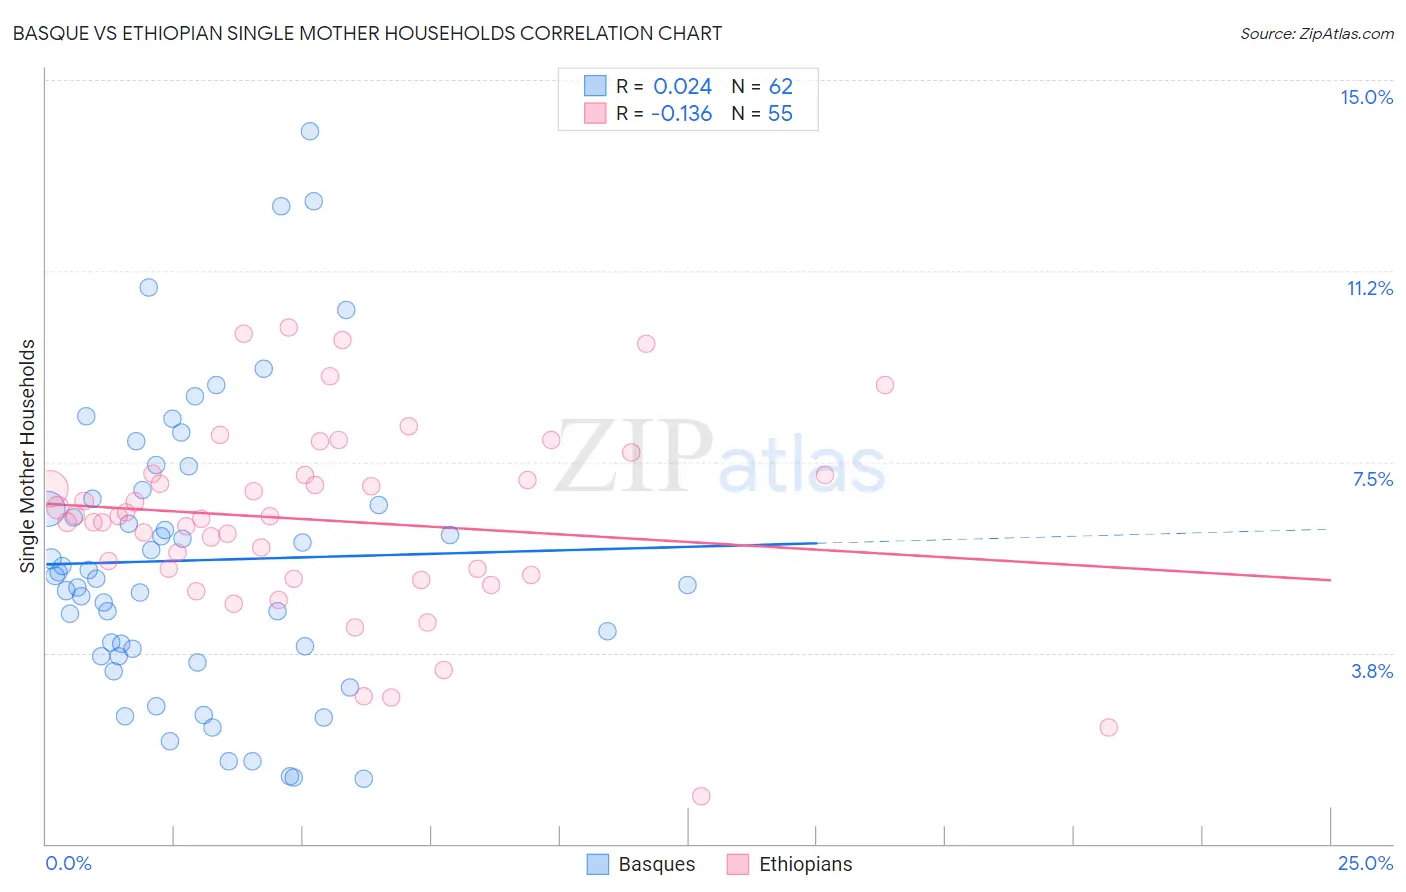
Basque vs Ethiopian Single Mother Households Correlation Chart
The statistical analysis conducted on geographies consisting of 165,555,400 people shows no correlation between the proportion of Basques and percentage of single mother households in the United States with a correlation coefficient (R) of 0.024 and weighted average of 5.7%. Similarly, the statistical analysis conducted on geographies consisting of 222,859,722 people shows a poor negative correlation between the proportion of Ethiopians and percentage of single mother households in the United States with a correlation coefficient (R) of -0.136 and weighted average of 6.5%, a difference of 13.3%.
Single Mother Households Correlation Summary
| Measurement | Basque | Ethiopian |
| Minimum | 1.3% | 0.92% |
| Maximum | 14.0% | 10.1% |
| Range | 12.7% | 9.2% |
| Mean | 5.6% | 6.4% |
| Median | 5.2% | 6.4% |
| Interquartile 25% (IQ1) | 3.7% | 5.3% |
| Interquartile 75% (IQ3) | 6.8% | 7.3% |
| Interquartile Range (IQR) | 3.1% | 2.0% |
| Standard Deviation (Sample) | 2.8% | 1.9% |
| Standard Deviation (Population) | 2.8% | 1.9% |
Similar Demographics by Single Mother Households
Demographics Similar to Basques by Single Mother Households
In terms of single mother households, the demographic groups most similar to Basques are Serbian (5.7%, a difference of 0.050%), Immigrants from Western Asia (5.7%, a difference of 0.060%), Slovak (5.7%, a difference of 0.060%), Austrian (5.7%, a difference of 0.21%), and Tlingit-Haida (5.7%, a difference of 0.26%).
| Demographics | Rating | Rank | Single Mother Households |
| Immigrants | Turkey | 97.5 /100 | #87 | Exceptional 5.7% |
| Israelis | 97.4 /100 | #88 | Exceptional 5.7% |
| Ukrainians | 97.2 /100 | #89 | Exceptional 5.7% |
| Immigrants | Indonesia | 97.2 /100 | #90 | Exceptional 5.7% |
| Europeans | 97.0 /100 | #91 | Exceptional 5.7% |
| Immigrants | Western Asia | 96.7 /100 | #92 | Exceptional 5.7% |
| Serbians | 96.7 /100 | #93 | Exceptional 5.7% |
| Basques | 96.7 /100 | #94 | Exceptional 5.7% |
| Slovaks | 96.6 /100 | #95 | Exceptional 5.7% |
| Austrians | 96.4 /100 | #96 | Exceptional 5.7% |
| Tlingit-Haida | 96.4 /100 | #97 | Exceptional 5.7% |
| Immigrants | South Africa | 96.3 /100 | #98 | Exceptional 5.7% |
| Immigrants | Poland | 96.3 /100 | #99 | Exceptional 5.8% |
| Scandinavians | 96.2 /100 | #100 | Exceptional 5.8% |
| Germans | 96.2 /100 | #101 | Exceptional 5.8% |
Demographics Similar to Ethiopians by Single Mother Households
In terms of single mother households, the demographic groups most similar to Ethiopians are Ugandan (6.5%, a difference of 0.060%), Costa Rican (6.5%, a difference of 0.17%), Immigrants from Afghanistan (6.5%, a difference of 0.19%), Spaniard (6.5%, a difference of 0.24%), and Ottawa (6.5%, a difference of 0.32%).
| Demographics | Rating | Rank | Single Mother Households |
| Osage | 43.0 /100 | #177 | Average 6.4% |
| Portuguese | 40.0 /100 | #178 | Fair 6.4% |
| Hmong | 39.8 /100 | #179 | Fair 6.4% |
| Immigrants | Nepal | 36.1 /100 | #180 | Fair 6.4% |
| Spanish | 33.4 /100 | #181 | Fair 6.4% |
| South American Indians | 33.4 /100 | #182 | Fair 6.4% |
| Spaniards | 27.8 /100 | #183 | Fair 6.5% |
| Ethiopians | 26.0 /100 | #184 | Fair 6.5% |
| Ugandans | 25.6 /100 | #185 | Fair 6.5% |
| Costa Ricans | 24.8 /100 | #186 | Fair 6.5% |
| Immigrants | Afghanistan | 24.7 /100 | #187 | Fair 6.5% |
| Ottawa | 23.8 /100 | #188 | Fair 6.5% |
| Delaware | 23.3 /100 | #189 | Fair 6.5% |
| Peruvians | 21.6 /100 | #190 | Fair 6.5% |
| Samoans | 21.2 /100 | #191 | Fair 6.5% |