Basque vs White/Caucasian In Labor Force | Age 20-24
COMPARE
Basque
White/Caucasian
In Labor Force | Age 20-24
In Labor Force | Age 20-24 Comparison
Basques
Whites/Caucasians
76.5%
IN LABOR FORCE | AGE 20-24
99.5/ 100
METRIC RATING
81st/ 347
METRIC RANK
76.9%
IN LABOR FORCE | AGE 20-24
99.9/ 100
METRIC RATING
64th/ 347
METRIC RANK
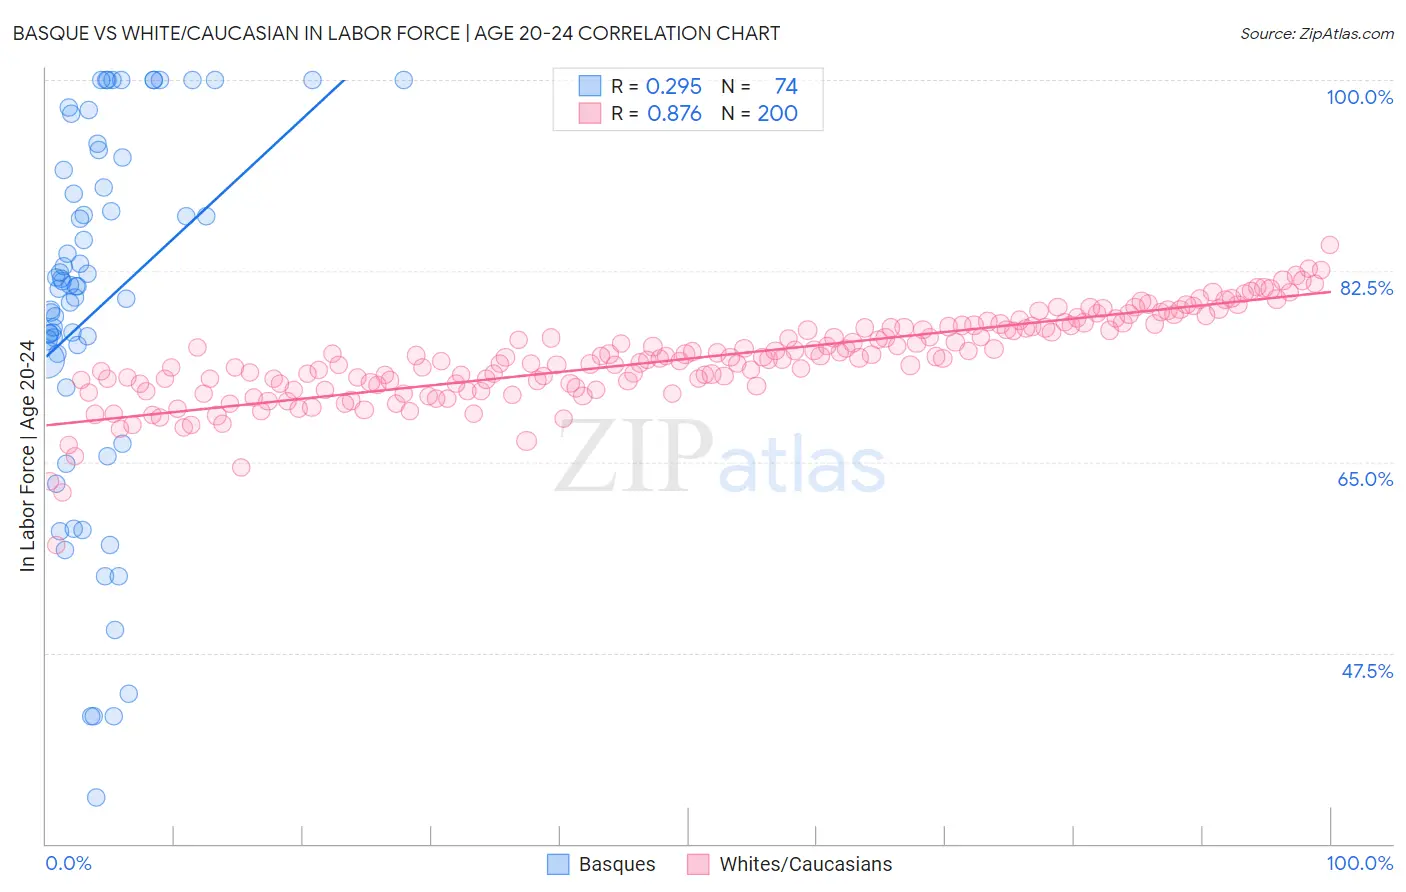
Basque vs White/Caucasian In Labor Force | Age 20-24 Correlation Chart
The statistical analysis conducted on geographies consisting of 165,718,076 people shows a weak positive correlation between the proportion of Basques and labor force participation rate among population between the ages 20 and 24 in the United States with a correlation coefficient (R) of 0.295 and weighted average of 76.5%. Similarly, the statistical analysis conducted on geographies consisting of 582,226,034 people shows a very strong positive correlation between the proportion of Whites/Caucasians and labor force participation rate among population between the ages 20 and 24 in the United States with a correlation coefficient (R) of 0.876 and weighted average of 76.9%, a difference of 0.52%.
In Labor Force | Age 20-24 Correlation Summary
| Measurement | Basque | White/Caucasian |
| Minimum | 34.2% | 57.4% |
| Maximum | 100.0% | 84.8% |
| Range | 65.8% | 27.5% |
| Mean | 79.0% | 74.5% |
| Median | 81.1% | 74.5% |
| Interquartile 25% (IQ1) | 74.4% | 72.1% |
| Interquartile 75% (IQ3) | 91.7% | 77.3% |
| Interquartile Range (IQR) | 17.3% | 5.2% |
| Standard Deviation (Sample) | 16.7% | 4.0% |
| Standard Deviation (Population) | 16.6% | 4.0% |
Demographics Similar to Basques and Whites/Caucasians by In Labor Force | Age 20-24
In terms of in labor force | age 20-24, the demographic groups most similar to Basques are Hmong (76.5%, a difference of 0.0%), Italian (76.5%, a difference of 0.020%), Immigrants from Zaire (76.6%, a difference of 0.040%), Canadian (76.6%, a difference of 0.060%), and Immigrants from Cameroon (76.6%, a difference of 0.070%). Similarly, the demographic groups most similar to Whites/Caucasians are Immigrants from Kenya (77.0%, a difference of 0.040%), Lithuanian (77.0%, a difference of 0.040%), Crow (76.9%, a difference of 0.050%), Icelander (76.9%, a difference of 0.070%), and Slavic (76.9%, a difference of 0.080%).
| Demographics | Rating | Rank | In Labor Force | Age 20-24 |
| Immigrants | Kenya | 99.9 /100 | #62 | Exceptional 77.0% |
| Lithuanians | 99.9 /100 | #63 | Exceptional 77.0% |
| Whites/Caucasians | 99.9 /100 | #64 | Exceptional 76.9% |
| Crow | 99.9 /100 | #65 | Exceptional 76.9% |
| Icelanders | 99.9 /100 | #66 | Exceptional 76.9% |
| Slavs | 99.9 /100 | #67 | Exceptional 76.9% |
| French American Indians | 99.8 /100 | #68 | Exceptional 76.8% |
| Immigrants | Sudan | 99.8 /100 | #69 | Exceptional 76.8% |
| Ottawa | 99.8 /100 | #70 | Exceptional 76.8% |
| Northern Europeans | 99.8 /100 | #71 | Exceptional 76.8% |
| Guamanians/Chamorros | 99.8 /100 | #72 | Exceptional 76.7% |
| British | 99.8 /100 | #73 | Exceptional 76.7% |
| Cree | 99.7 /100 | #74 | Exceptional 76.6% |
| Immigrants | Middle Africa | 99.7 /100 | #75 | Exceptional 76.6% |
| Immigrants | Moldova | 99.6 /100 | #76 | Exceptional 76.6% |
| Immigrants | Cameroon | 99.6 /100 | #77 | Exceptional 76.6% |
| Canadians | 99.6 /100 | #78 | Exceptional 76.6% |
| Immigrants | Zaire | 99.6 /100 | #79 | Exceptional 76.6% |
| Italians | 99.6 /100 | #80 | Exceptional 76.5% |
| Basques | 99.5 /100 | #81 | Exceptional 76.5% |
| Hmong | 99.5 /100 | #82 | Exceptional 76.5% |