Bangladeshi vs Comanche In Labor Force | Age 30-34
COMPARE
Bangladeshi
Comanche
In Labor Force | Age 30-34
In Labor Force | Age 30-34 Comparison
Bangladeshis
Comanche
84.3%
IN LABOR FORCE | AGE 30-34
9.4/ 100
METRIC RATING
207th/ 347
METRIC RANK
82.6%
IN LABOR FORCE | AGE 30-34
0.0/ 100
METRIC RATING
297th/ 347
METRIC RANK
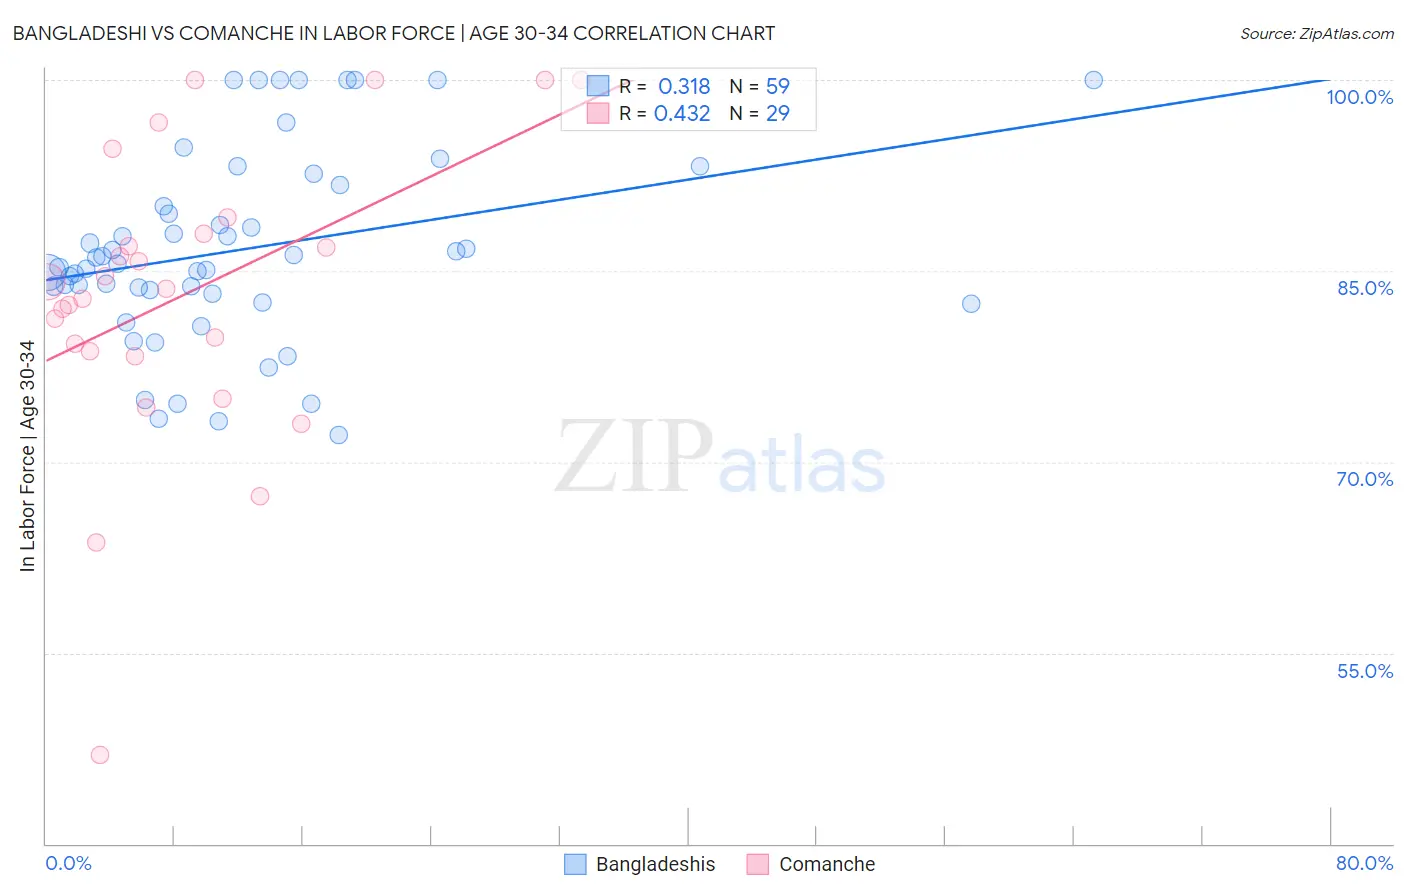
Bangladeshi vs Comanche In Labor Force | Age 30-34 Correlation Chart
The statistical analysis conducted on geographies consisting of 141,415,377 people shows a mild positive correlation between the proportion of Bangladeshis and labor force participation rate among population between the ages 30 and 34 in the United States with a correlation coefficient (R) of 0.318 and weighted average of 84.3%. Similarly, the statistical analysis conducted on geographies consisting of 109,766,840 people shows a moderate positive correlation between the proportion of Comanche and labor force participation rate among population between the ages 30 and 34 in the United States with a correlation coefficient (R) of 0.432 and weighted average of 82.6%, a difference of 2.1%.
In Labor Force | Age 30-34 Correlation Summary
| Measurement | Bangladeshi | Comanche |
| Minimum | 72.1% | 46.9% |
| Maximum | 100.0% | 100.0% |
| Range | 27.9% | 53.1% |
| Mean | 86.7% | 83.1% |
| Median | 85.5% | 83.6% |
| Interquartile 25% (IQ1) | 83.2% | 78.5% |
| Interquartile 75% (IQ3) | 91.8% | 88.5% |
| Interquartile Range (IQR) | 8.6% | 10.0% |
| Standard Deviation (Sample) | 7.5% | 11.7% |
| Standard Deviation (Population) | 7.4% | 11.5% |
Similar Demographics by In Labor Force | Age 30-34
Demographics Similar to Bangladeshis by In Labor Force | Age 30-34
In terms of in labor force | age 30-34, the demographic groups most similar to Bangladeshis are Arab (84.3%, a difference of 0.010%), Jamaican (84.3%, a difference of 0.010%), Indonesian (84.3%, a difference of 0.010%), Japanese (84.3%, a difference of 0.010%), and Lebanese (84.4%, a difference of 0.020%).
| Demographics | Rating | Rank | In Labor Force | Age 30-34 |
| Sub-Saharan Africans | 19.0 /100 | #200 | Poor 84.5% |
| Trinidadians and Tobagonians | 18.2 /100 | #201 | Poor 84.5% |
| Immigrants | West Indies | 18.1 /100 | #202 | Poor 84.5% |
| Canadians | 15.4 /100 | #203 | Poor 84.4% |
| Ecuadorians | 14.2 /100 | #204 | Poor 84.4% |
| French | 13.8 /100 | #205 | Poor 84.4% |
| Lebanese | 10.6 /100 | #206 | Poor 84.4% |
| Bangladeshis | 9.4 /100 | #207 | Tragic 84.3% |
| Arabs | 8.9 /100 | #208 | Tragic 84.3% |
| Jamaicans | 8.8 /100 | #209 | Tragic 84.3% |
| Indonesians | 8.8 /100 | #210 | Tragic 84.3% |
| Japanese | 8.8 /100 | #211 | Tragic 84.3% |
| Immigrants | Western Asia | 8.2 /100 | #212 | Tragic 84.3% |
| Immigrants | Jamaica | 7.9 /100 | #213 | Tragic 84.3% |
| Immigrants | Germany | 7.2 /100 | #214 | Tragic 84.3% |
Demographics Similar to Comanche by In Labor Force | Age 30-34
In terms of in labor force | age 30-34, the demographic groups most similar to Comanche are Aleut (82.6%, a difference of 0.0%), Chippewa (82.6%, a difference of 0.010%), Pennsylvania German (82.6%, a difference of 0.030%), Immigrants from Central America (82.5%, a difference of 0.13%), and American (82.7%, a difference of 0.15%).
| Demographics | Rating | Rank | In Labor Force | Age 30-34 |
| Blackfeet | 0.0 /100 | #290 | Tragic 82.8% |
| Potawatomi | 0.0 /100 | #291 | Tragic 82.8% |
| Blacks/African Americans | 0.0 /100 | #292 | Tragic 82.8% |
| Nepalese | 0.0 /100 | #293 | Tragic 82.7% |
| Americans | 0.0 /100 | #294 | Tragic 82.7% |
| Pennsylvania Germans | 0.0 /100 | #295 | Tragic 82.6% |
| Chippewa | 0.0 /100 | #296 | Tragic 82.6% |
| Comanche | 0.0 /100 | #297 | Tragic 82.6% |
| Aleuts | 0.0 /100 | #298 | Tragic 82.6% |
| Immigrants | Central America | 0.0 /100 | #299 | Tragic 82.5% |
| Hmong | 0.0 /100 | #300 | Tragic 82.4% |
| Hispanics or Latinos | 0.0 /100 | #301 | Tragic 82.4% |
| Ottawa | 0.0 /100 | #302 | Tragic 82.4% |
| Immigrants | Micronesia | 0.0 /100 | #303 | Tragic 82.4% |
| Tlingit-Haida | 0.0 /100 | #304 | Tragic 82.3% |