Immigrants from Belize vs Turkish In Labor Force | Age > 16
COMPARE
Immigrants from Belize
Turkish
In Labor Force | Age > 16
In Labor Force | Age > 16 Comparison
Immigrants from Belize
Turks
64.7%
IN LABOR FORCE | AGE > 16
9.2/ 100
METRIC RATING
223rd/ 347
METRIC RANK
66.1%
IN LABOR FORCE | AGE > 16
99.6/ 100
METRIC RATING
79th/ 347
METRIC RANK
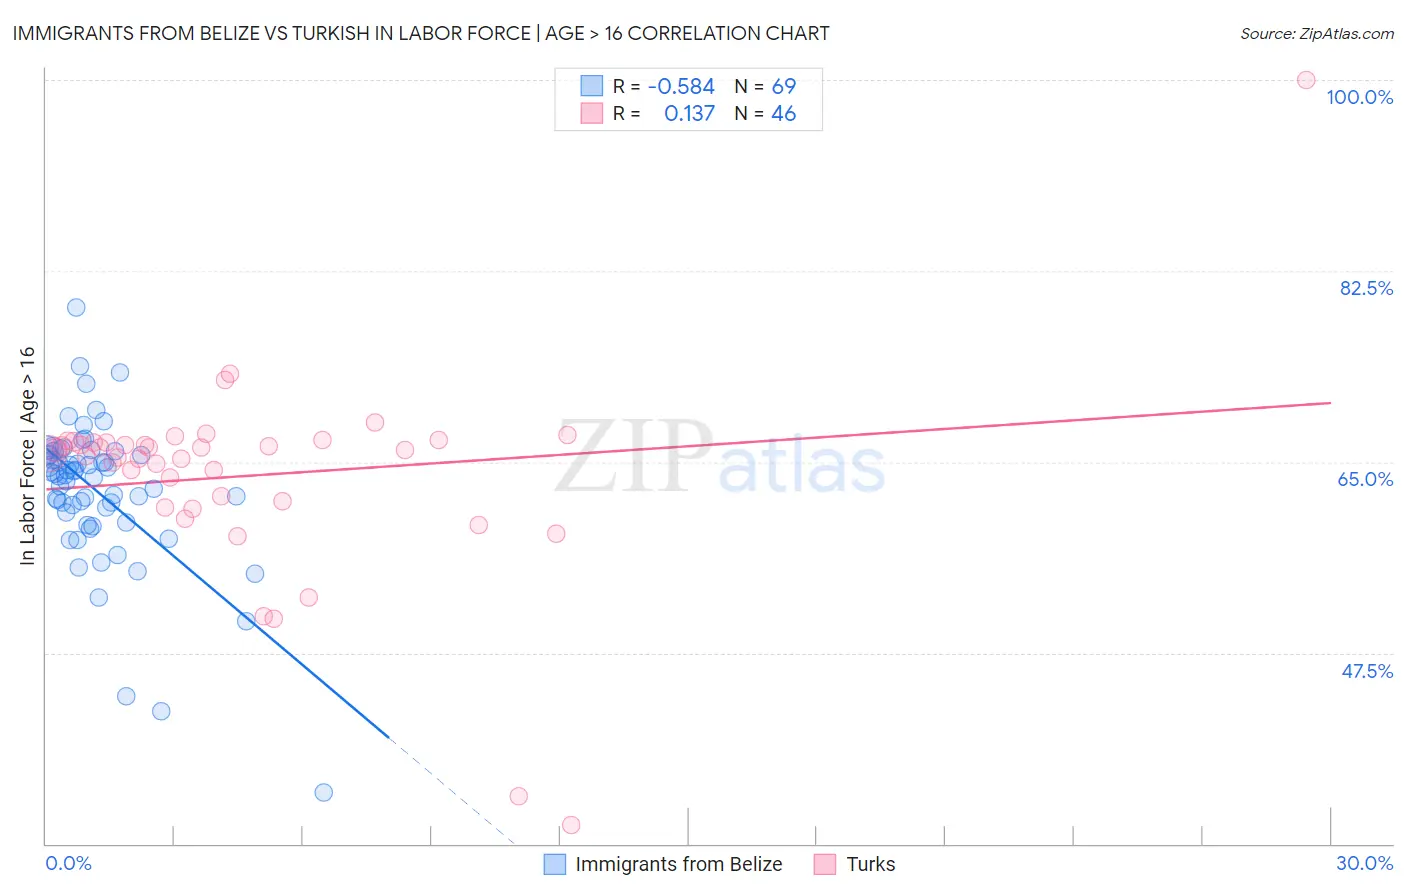
Immigrants from Belize vs Turkish In Labor Force | Age > 16 Correlation Chart
The statistical analysis conducted on geographies consisting of 130,317,251 people shows a substantial negative correlation between the proportion of Immigrants from Belize and labor force participation rate among population ages 16 and over in the United States with a correlation coefficient (R) of -0.584 and weighted average of 64.7%. Similarly, the statistical analysis conducted on geographies consisting of 271,859,072 people shows a poor positive correlation between the proportion of Turks and labor force participation rate among population ages 16 and over in the United States with a correlation coefficient (R) of 0.137 and weighted average of 66.1%, a difference of 2.2%.
In Labor Force | Age > 16 Correlation Summary
| Measurement | Immigrants from Belize | Turkish |
| Minimum | 34.7% | 31.7% |
| Maximum | 79.2% | 100.0% |
| Range | 44.5% | 68.3% |
| Mean | 62.3% | 63.7% |
| Median | 63.8% | 65.9% |
| Interquartile 25% (IQ1) | 59.9% | 61.4% |
| Interquartile 75% (IQ3) | 65.8% | 66.8% |
| Interquartile Range (IQR) | 5.9% | 5.4% |
| Standard Deviation (Sample) | 6.8% | 9.6% |
| Standard Deviation (Population) | 6.8% | 9.5% |
Similar Demographics by In Labor Force | Age > 16
Demographics Similar to Immigrants from Belize by In Labor Force | Age > 16
In terms of in labor force | age > 16, the demographic groups most similar to Immigrants from Belize are Hawaiian (64.7%, a difference of 0.0%), Immigrants from Micronesia (64.7%, a difference of 0.010%), Immigrants from Jamaica (64.7%, a difference of 0.010%), Croatian (64.7%, a difference of 0.010%), and Alaska Native (64.7%, a difference of 0.020%).
| Demographics | Rating | Rank | In Labor Force | Age > 16 |
| Belgians | 11.4 /100 | #216 | Poor 64.7% |
| U.S. Virgin Islanders | 11.3 /100 | #217 | Poor 64.7% |
| Alsatians | 10.7 /100 | #218 | Poor 64.7% |
| Immigrants | Central America | 10.5 /100 | #219 | Poor 64.7% |
| Alaska Natives | 9.9 /100 | #220 | Tragic 64.7% |
| Immigrants | Micronesia | 9.6 /100 | #221 | Tragic 64.7% |
| Hawaiians | 9.3 /100 | #222 | Tragic 64.7% |
| Immigrants | Belize | 9.2 /100 | #223 | Tragic 64.7% |
| Immigrants | Jamaica | 8.8 /100 | #224 | Tragic 64.7% |
| Croatians | 8.8 /100 | #225 | Tragic 64.7% |
| Europeans | 8.3 /100 | #226 | Tragic 64.7% |
| Poles | 8.3 /100 | #227 | Tragic 64.7% |
| Northern Europeans | 8.2 /100 | #228 | Tragic 64.7% |
| British | 7.3 /100 | #229 | Tragic 64.7% |
| Chinese | 7.3 /100 | #230 | Tragic 64.7% |
Demographics Similar to Turks by In Labor Force | Age > 16
In terms of in labor force | age > 16, the demographic groups most similar to Turks are Malaysian (66.1%, a difference of 0.010%), Immigrants from Moldova (66.1%, a difference of 0.030%), Immigrants from Asia (66.1%, a difference of 0.030%), Immigrants from Malaysia (66.1%, a difference of 0.040%), and Moroccan (66.1%, a difference of 0.060%).
| Demographics | Rating | Rank | In Labor Force | Age > 16 |
| Taiwanese | 99.7 /100 | #72 | Exceptional 66.2% |
| Immigrants | Vietnam | 99.7 /100 | #73 | Exceptional 66.2% |
| Immigrants | Korea | 99.7 /100 | #74 | Exceptional 66.2% |
| Immigrants | Singapore | 99.7 /100 | #75 | Exceptional 66.2% |
| Immigrants | Malaysia | 99.6 /100 | #76 | Exceptional 66.1% |
| Immigrants | Moldova | 99.6 /100 | #77 | Exceptional 66.1% |
| Immigrants | Asia | 99.6 /100 | #78 | Exceptional 66.1% |
| Turks | 99.6 /100 | #79 | Exceptional 66.1% |
| Malaysians | 99.6 /100 | #80 | Exceptional 66.1% |
| Moroccans | 99.5 /100 | #81 | Exceptional 66.1% |
| German Russians | 99.4 /100 | #82 | Exceptional 66.1% |
| Immigrants | Jordan | 99.4 /100 | #83 | Exceptional 66.1% |
| Central Americans | 99.4 /100 | #84 | Exceptional 66.1% |
| Mongolians | 99.4 /100 | #85 | Exceptional 66.1% |
| South Americans | 99.4 /100 | #86 | Exceptional 66.0% |