Australian vs Somali Median Female Earnings
COMPARE
Australian
Somali
Median Female Earnings
Median Female Earnings Comparison
Australians
Somalis
$43,308
MEDIAN FEMALE EARNINGS
99.9/ 100
METRIC RATING
54th/ 347
METRIC RANK
$38,333
MEDIAN FEMALE EARNINGS
5.5/ 100
METRIC RATING
231st/ 347
METRIC RANK
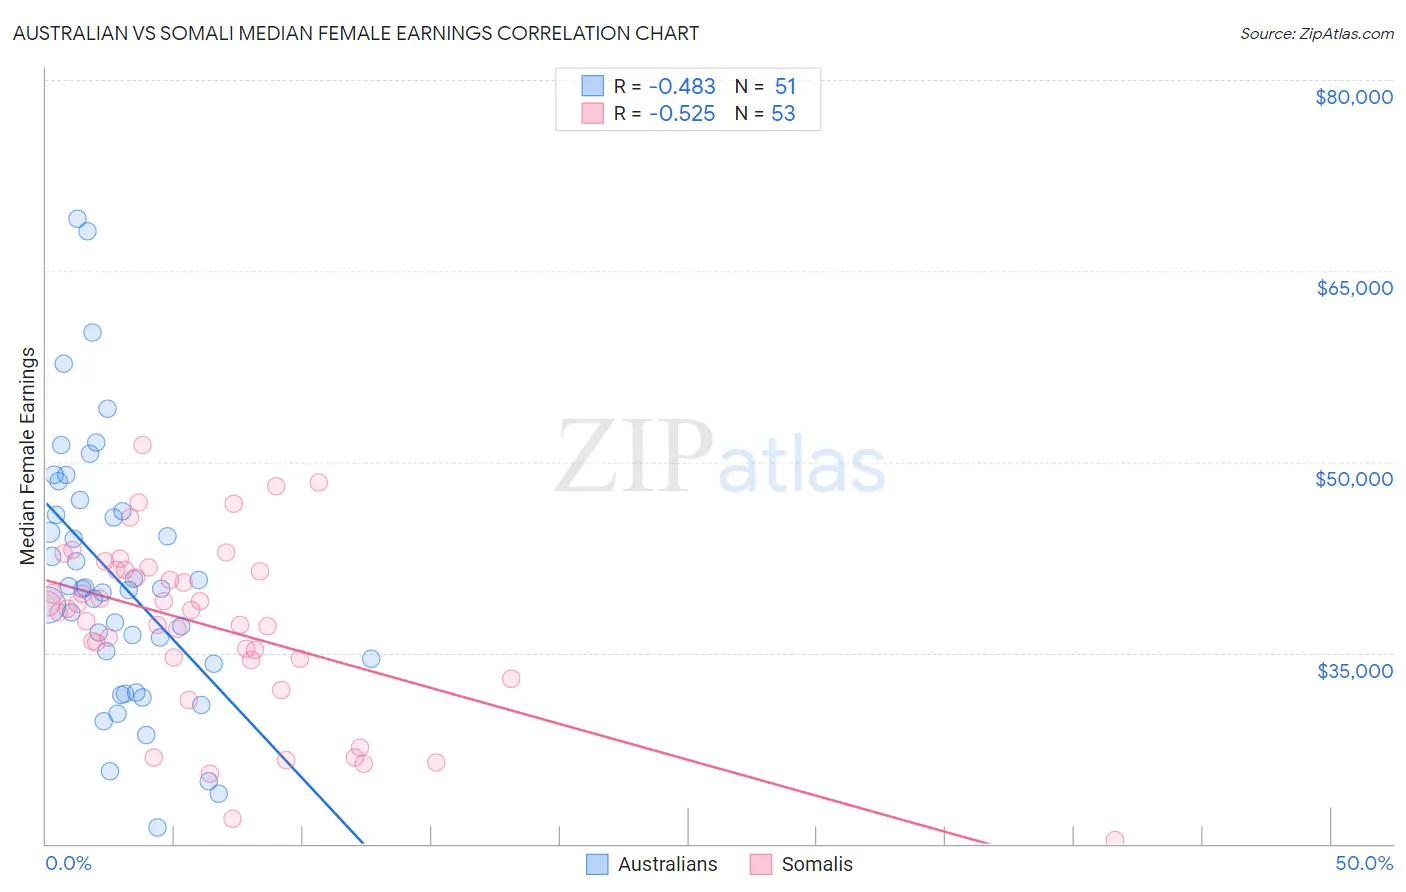
Australian vs Somali Median Female Earnings Correlation Chart
The statistical analysis conducted on geographies consisting of 224,101,413 people shows a moderate negative correlation between the proportion of Australians and median female earnings in the United States with a correlation coefficient (R) of -0.483 and weighted average of $43,308. Similarly, the statistical analysis conducted on geographies consisting of 99,326,973 people shows a substantial negative correlation between the proportion of Somalis and median female earnings in the United States with a correlation coefficient (R) of -0.525 and weighted average of $38,333, a difference of 13.0%.
Median Female Earnings Correlation Summary
| Measurement | Australian | Somali |
| Minimum | $21,275 | $20,281 |
| Maximum | $69,107 | $51,368 |
| Range | $47,832 | $31,087 |
| Mean | $40,748 | $37,176 |
| Median | $40,021 | $38,333 |
| Interquartile 25% (IQ1) | $34,140 | $34,463 |
| Interquartile 75% (IQ3) | $46,088 | $41,523 |
| Interquartile Range (IQR) | $11,949 | $7,060 |
| Standard Deviation (Sample) | $10,236 | $6,829 |
| Standard Deviation (Population) | $10,135 | $6,765 |
Similar Demographics by Median Female Earnings
Demographics Similar to Australians by Median Female Earnings
In terms of median female earnings, the demographic groups most similar to Australians are Immigrants from Eastern Europe ($43,309, a difference of 0.0%), Egyptian ($43,305, a difference of 0.010%), Immigrants from Lithuania ($43,317, a difference of 0.020%), Maltese ($43,357, a difference of 0.11%), and Immigrants from Croatia ($43,258, a difference of 0.11%).
| Demographics | Rating | Rank | Median Female Earnings |
| Bolivians | 100.0 /100 | #47 | Exceptional $43,445 |
| Immigrants | Indonesia | 100.0 /100 | #48 | Exceptional $43,412 |
| Immigrants | Serbia | 100.0 /100 | #49 | Exceptional $43,385 |
| Immigrants | Uzbekistan | 100.0 /100 | #50 | Exceptional $43,363 |
| Maltese | 100.0 /100 | #51 | Exceptional $43,357 |
| Immigrants | Lithuania | 99.9 /100 | #52 | Exceptional $43,317 |
| Immigrants | Eastern Europe | 99.9 /100 | #53 | Exceptional $43,309 |
| Australians | 99.9 /100 | #54 | Exceptional $43,308 |
| Egyptians | 99.9 /100 | #55 | Exceptional $43,305 |
| Immigrants | Croatia | 99.9 /100 | #56 | Exceptional $43,258 |
| Ethiopians | 99.9 /100 | #57 | Exceptional $43,243 |
| Paraguayans | 99.9 /100 | #58 | Exceptional $43,173 |
| Estonians | 99.9 /100 | #59 | Exceptional $43,106 |
| Immigrants | Latvia | 99.9 /100 | #60 | Exceptional $43,099 |
| Immigrants | Bulgaria | 99.9 /100 | #61 | Exceptional $43,085 |
Demographics Similar to Somalis by Median Female Earnings
In terms of median female earnings, the demographic groups most similar to Somalis are Basque ($38,352, a difference of 0.050%), Scandinavian ($38,306, a difference of 0.070%), Tongan ($38,288, a difference of 0.12%), Belgian ($38,382, a difference of 0.13%), and Celtic ($38,283, a difference of 0.13%).
| Demographics | Rating | Rank | Median Female Earnings |
| Native Hawaiians | 7.1 /100 | #224 | Tragic $38,461 |
| French | 7.0 /100 | #225 | Tragic $38,457 |
| French Canadians | 6.8 /100 | #226 | Tragic $38,436 |
| Scottish | 6.3 /100 | #227 | Tragic $38,397 |
| Sub-Saharan Africans | 6.2 /100 | #228 | Tragic $38,391 |
| Belgians | 6.1 /100 | #229 | Tragic $38,382 |
| Basques | 5.7 /100 | #230 | Tragic $38,352 |
| Somalis | 5.5 /100 | #231 | Tragic $38,333 |
| Scandinavians | 5.2 /100 | #232 | Tragic $38,306 |
| Tongans | 5.1 /100 | #233 | Tragic $38,288 |
| Celtics | 5.0 /100 | #234 | Tragic $38,283 |
| Sudanese | 4.4 /100 | #235 | Tragic $38,215 |
| Liberians | 4.4 /100 | #236 | Tragic $38,215 |
| Immigrants | Cabo Verde | 4.3 /100 | #237 | Tragic $38,208 |
| Alaska Natives | 4.3 /100 | #238 | Tragic $38,202 |