Australian vs Immigrants from Western Africa In Labor Force | Age 25-29

COMPARE

Australian
Race
Ancestry
AfghanAfricanAlaska NativeAlaskan AthabascanAlbanianAleutAlsatianAmericanApacheArabArapahoArgentineanArmenianAssyrian/Chaldean/SyriacAustralianAustrianBahamianBangladeshiBarbadianBasqueBelgianBelizeanBermudanBhutaneseBlackfeetBolivianBrazilianBritishBritish West IndianBulgarianBurmeseCajunCambodianCanadianCape VerdeanCarpatho RusynCelticCentral AmericanCentral American IndianCherokeeCheyenneChickasawChileanChineseChippewaChoctawColombianColvilleComancheCosta RicanCreeCreekCroatianCrowCubanCypriotCzechCzechoslovakianDanishDelawareDominicanDutchDutch West IndianEastern EuropeanEcuadorianEgyptianEnglishEstonianEthiopianEuropeanFijianFilipinoFinnishFrenchFrench American IndianFrench CanadianGermanGerman RussianGhanaianGreekGuamanian/ChamorroGuatemalanGuyaneseHaitianHmongHonduranHopiHoumaHungarianIcelanderIndian (Asian)IndonesianInupiatIranianIraqiIrishIroquoisIsraeliItalianJamaicanJapaneseJordanianKenyanKiowaKoreanLaotianLatvianLebaneseLiberianLithuanianLumbeeLuxembourgerMacedonianMalaysianMalteseMarshalleseMenomineeMexicanMexican American IndianMongolianMoroccanNative HawaiianNavajoNepaleseNew ZealanderNicaraguanNigerianNorthern EuropeanNorwegianOkinawanOsageOttawaPaiutePakistaniPalestinianPanamanianParaguayanPennsylvania GermanPeruvianPimaPolishPortuguesePotawatomiPuebloPuerto RicanPuget Sound SalishRomanianRussianSalvadoranSamoanScandinavianScotch-IrishScottishSeminoleSenegaleseSerbianShoshoneSierra LeoneanSiouxSlavicSlovakSloveneSomaliSouth AfricanSouth AmericanSouth American IndianSoviet UnionSpaniardSpanishSpanish AmericanSpanish American IndianSri LankanSubsaharan AfricanSudaneseSwedishSwissSyrianTaiwaneseThaiTlingit-HaidaTohono O'OdhamTonganTrinidadian and TobagonianTsimshianTurkishU.S. Virgin IslanderUgandanUkrainianUruguayanUteVenezuelanVietnameseWelshWest IndianYakamaYaquiYugoslavianYumanYup'ikZimbabwean
Immigration
NonimmigrantsImmigrantsAfghanistanAfricaAlbaniaArgentinaArmeniaAsiaAustraliaAustriaBahamasBangladeshBarbadosBelarusBelgiumBelizeBoliviaBosnia and HerzegovinaBrazilBulgariaBurma/MyanmarCabo VerdeCambodiaCameroonCanadaCaribbeanCentral AmericaChileChinaColombiaCongoCosta RicaCroatiaCubaCzechoslovakiaDenmarkDominicaDominican RepublicEastern AfricaEastern AsiaEastern EuropeEcuadorEgyptEl SalvadorEnglandEritreaEthiopiaEuropeFijiFranceGermanyGhanaGreeceGrenadaGuatemalaGuyanaHaitiHondurasHong KongHungaryIndiaIndonesiaIranIraqIrelandIsraelItalyJamaicaJapanJordanKazakhstanKenyaKoreaKuwaitLaosLatin AmericaLatviaLebanonLiberiaLithuaniaMalaysiaMexicoMicronesiaMiddle AfricaMoldovaMoroccoNepalNetherlandsNicaraguaNigeriaNorth AmericaNorth MacedoniaNorthern AfricaNorthern EuropeNorwayOceaniaPakistanPanamaPeruPhilippinesPolandPortugalRomaniaRussiaSaudi ArabiaScotlandSenegalSerbiaSierra LeoneSingaporeSomaliaSouth AfricaSouth AmericaSouth Central AsiaSouth Eastern AsiaSouthern EuropeSpainSri LankaSt. Vincent and the GrenadinesSudanSwedenSwitzerlandSyriaTaiwanThailandTrinidad and TobagoTurkeyUgandaUkraineUruguayUzbekistanVenezuelaVietnamWest IndiesWestern AsiaWestern EuropeYemenZaireZimbabweAzores
Immigrants from Western Africa
Race
Ancestry
AfghanAfricanAlaska NativeAlaskan AthabascanAlbanianAleutAlsatianAmericanApacheArabArapahoArgentineanArmenianAssyrian/Chaldean/SyriacAustrianBahamianBangladeshiBarbadianBasqueBelgianBelizeanBermudanBhutaneseBlackfeetBolivianBrazilianBritishBritish West IndianBulgarianBurmeseCajunCambodianCanadianCape VerdeanCarpatho RusynCelticCentral AmericanCentral American IndianCherokeeCheyenneChickasawChileanChineseChippewaChoctawColombianColvilleComancheCosta RicanCreeCreekCroatianCrowCubanCypriotCzechCzechoslovakianDanishDelawareDominicanDutchDutch West IndianEastern EuropeanEcuadorianEgyptianEnglishEstonianEthiopianEuropeanFijianFilipinoFinnishFrenchFrench American IndianFrench CanadianGermanGerman RussianGhanaianGreekGuamanian/ChamorroGuatemalanGuyaneseHaitianHmongHonduranHopiHoumaHungarianIcelanderIndian (Asian)IndonesianInupiatIranianIraqiIrishIroquoisIsraeliItalianJamaicanJapaneseJordanianKenyanKiowaKoreanLaotianLatvianLebaneseLiberianLithuanianLumbeeLuxembourgerMacedonianMalaysianMalteseMarshalleseMenomineeMexicanMexican American IndianMongolianMoroccanNative HawaiianNavajoNepaleseNew ZealanderNicaraguanNigerianNorthern EuropeanNorwegianOkinawanOsageOttawaPaiutePakistaniPalestinianPanamanianParaguayanPennsylvania GermanPeruvianPimaPolishPortuguesePotawatomiPuebloPuerto RicanPuget Sound SalishRomanianRussianSalvadoranSamoanScandinavianScotch-IrishScottishSeminoleSenegaleseSerbianShoshoneSierra LeoneanSiouxSlavicSlovakSloveneSomaliSouth AfricanSouth AmericanSouth American IndianSoviet UnionSpaniardSpanishSpanish AmericanSpanish American IndianSri LankanSubsaharan AfricanSudaneseSwedishSwissSyrianTaiwaneseThaiTlingit-HaidaTohono O'OdhamTonganTrinidadian and TobagonianTsimshianTurkishU.S. Virgin IslanderUgandanUkrainianUruguayanUteVenezuelanVietnameseWelshWest IndianYakamaYaquiYugoslavianYumanYup'ikZimbabwean
Immigration
NonimmigrantsImmigrantsAfghanistanAfricaAlbaniaArgentinaArmeniaAsiaAustraliaAustriaBahamasBangladeshBarbadosBelarusBelgiumBelizeBoliviaBosnia and HerzegovinaBrazilBulgariaBurma/MyanmarCabo VerdeCambodiaCameroonCanadaCaribbeanCentral AmericaChileChinaColombiaCongoCosta RicaCroatiaCubaCzechoslovakiaDenmarkDominicaDominican RepublicEastern AfricaEastern AsiaEastern EuropeEcuadorEgyptEl SalvadorEnglandEritreaEthiopiaEuropeFijiFranceGermanyGhanaGreeceGrenadaGuatemalaGuyanaHaitiHondurasHong KongHungaryIndiaIndonesiaIranIraqIrelandIsraelItalyJamaicaJapanJordanKazakhstanKenyaKoreaKuwaitLaosLatin AmericaLatviaLebanonLiberiaLithuaniaMalaysiaMexicoMicronesiaMiddle AfricaMoldovaMoroccoNepalNetherlandsNicaraguaNigeriaNorth AmericaNorth MacedoniaNorthern AfricaNorthern EuropeNorwayOceaniaPakistanPanamaPeruPhilippinesPolandPortugalRomaniaRussiaSaudi ArabiaScotlandSenegalSerbiaSierra LeoneSingaporeSomaliaSouth AfricaSouth AmericaSouth Central AsiaSouth Eastern AsiaSouthern EuropeSpainSri LankaSt. Vincent and the GrenadinesSudanSwedenSwitzerlandSyriaTaiwanThailandTrinidad and TobagoTurkeyUgandaUkraineUruguayUzbekistanVenezuelaVietnamWest IndiesWestern AfricaWestern AsiaWestern EuropeYemenZaireZimbabweAzores
In Labor Force | Age 25-29
Income
Poverty
Unemployment
Labor Participation
Family Structure
Vehicle Availability
Education Level
Disability

In Labor Force | Age 25-29 Comparison

Australians

Immigrants from Western Africa

Excellent
Good
84.9%
IN LABOR FORCE | AGE 25-29
83.6/ 100
METRIC RATING
128th/ 347
METRIC RANK
84.7%
IN LABOR FORCE | AGE 25-29
60.1/ 100
METRIC RATING
159th/ 347
METRIC RANK

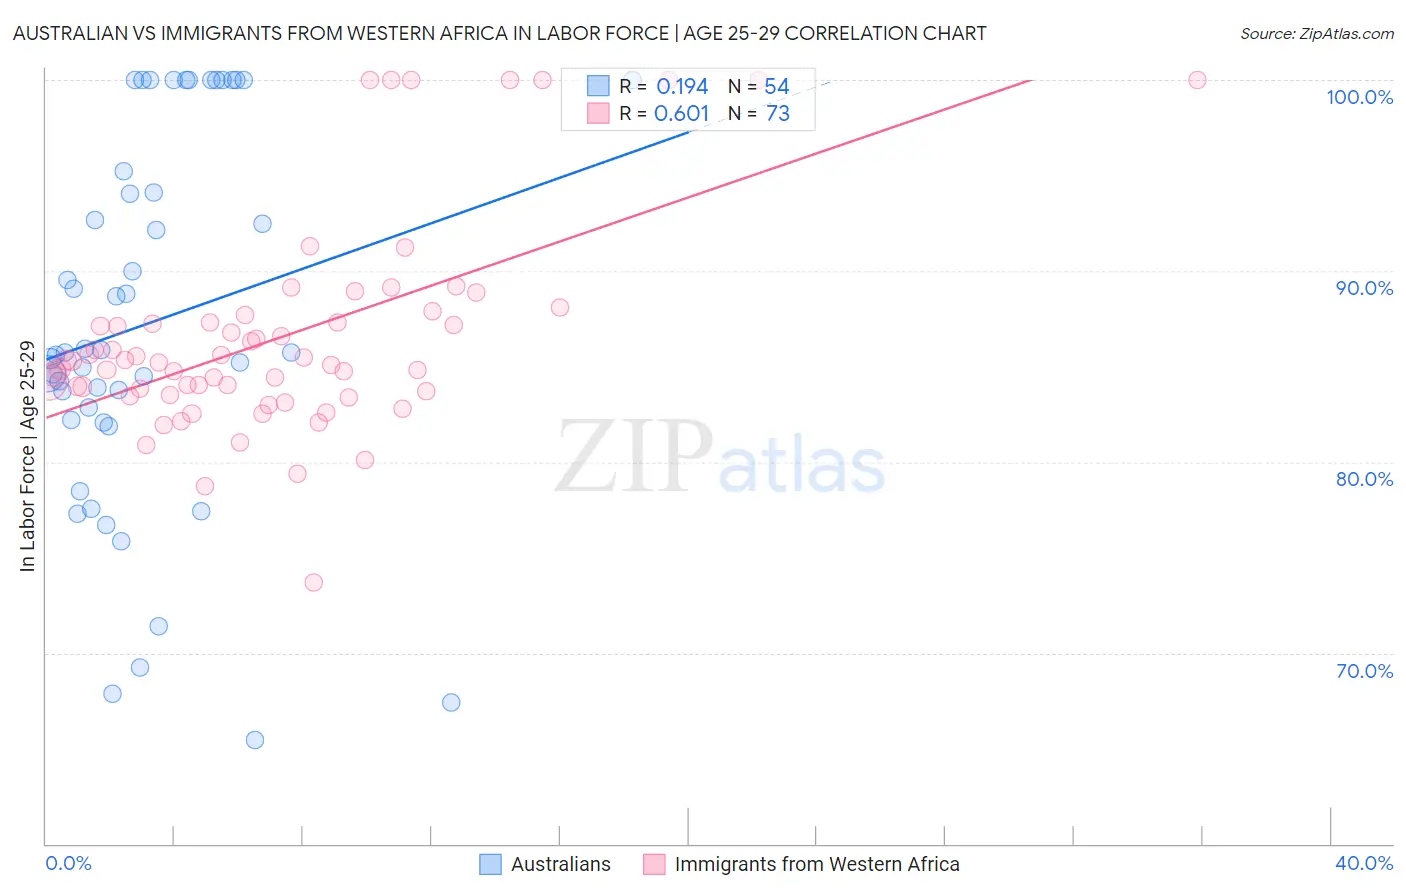
Australian vs Immigrants from Western Africa In Labor Force | Age 25-29 Correlation Chart

The statistical analysis conducted on geographies consisting of 224,101,072 people shows a poor positive correlation between the proportion of Australians and labor force participation rate among population between the ages 25 and 29 in the United States with a correlation coefficient (R) of 0.194 and weighted average of 84.9%. Similarly, the statistical analysis conducted on geographies consisting of 357,777,968 people shows a significant positive correlation between the proportion of Immigrants from Western Africa and labor force participation rate among population between the ages 25 and 29 in the United States with a correlation coefficient (R) of 0.601 and weighted average of 84.7%, a difference of 0.22%.
Australian vs Immigrants from Western Africa In Labor Force | Age 25-29

In Labor Force | Age 25-29 Correlation Summary

MeasurementAustralianImmigrants from Western Africa
Minimum65.4%73.7%
Maximum100.0%100.0%
Range34.6%26.3%
Mean87.3%86.5%
Median85.7%85.3%
Interquartile 25% (IQ1)82.2%83.6%
Interquartile 75% (IQ3)95.2%87.5%
Interquartile Range (IQR)13.0%3.9%
Standard Deviation (Sample)9.7%5.5%
Standard Deviation (Population)9.6%5.5%

Similar Demographics by In Labor Force | Age 25-29

Demographics Similar to Australians by In Labor Force | Age 25-29

In terms of in labor force | age 25-29, the demographic groups most similar to Australians are Uruguayan (84.9%, a difference of 0.010%), Immigrants from Singapore (84.9%, a difference of 0.010%), Immigrants from Uruguay (84.9%, a difference of 0.010%), Scandinavian (84.9%, a difference of 0.020%), and Dutch (84.9%, a difference of 0.020%).
DemographicsRating | RankIn Labor Force | Age 25-29
Immigrants | Chile
85.6
/100
|
#121
Excellent
84.9%
Scandinavians
85.1
/100
|
#122
Excellent
84.9%
Dutch
84.9
/100
|
#123
Excellent
84.9%
Immigrants | Iran
84.8
/100
|
#124
Excellent
84.9%
Uruguayans
84.7
/100
|
#125
Excellent
84.9%
Immigrants | Singapore
84.4
/100
|
#126
Excellent
84.9%
Immigrants | Uruguay
84.0
/100
|
#127
Excellent
84.9%
Australians
83.6
/100
|
#128
Excellent
84.9%
Immigrants | Russia
81.6
/100
|
#129
Excellent
84.9%
Northern Europeans
81.3
/100
|
#130
Excellent
84.9%
Iranians
78.1
/100
|
#131
Good
84.8%
Romanians
77.7
/100
|
#132
Good
84.8%
Asians
77.7
/100
|
#133
Good
84.8%
Syrians
76.5
/100
|
#134
Good
84.8%
Immigrants | Hungary
76.4
/100
|
#135
Good
84.8%

Demographics Similar to Immigrants from Western Africa by In Labor Force | Age 25-29

In terms of in labor force | age 25-29, the demographic groups most similar to Immigrants from Western Africa are British (84.7%, a difference of 0.0%), Immigrants from Ghana (84.7%, a difference of 0.0%), Immigrants from Sri Lanka (84.7%, a difference of 0.010%), Indian (Asian) (84.7%, a difference of 0.010%), and French (84.7%, a difference of 0.010%).
DemographicsRating | RankIn Labor Force | Age 25-29
Immigrants | Pakistan
62.7
/100
|
#152
Good
84.7%
Immigrants | Taiwan
62.2
/100
|
#153
Good
84.7%
Immigrants | Sri Lanka
61.7
/100
|
#154
Good
84.7%
Indians (Asian)
61.6
/100
|
#155
Good
84.7%
French
61.0
/100
|
#156
Good
84.7%
British
60.4
/100
|
#157
Good
84.7%
Immigrants | Ghana
60.2
/100
|
#158
Good
84.7%
Immigrants | Western Africa
60.1
/100
|
#159
Good
84.7%
Immigrants | Peru
58.6
/100
|
#160
Average
84.7%
Canadians
58.5
/100
|
#161
Average
84.7%
Immigrants | Colombia
58.3
/100
|
#162
Average
84.7%
Argentineans
57.9
/100
|
#163
Average
84.7%
Ghanaians
57.6
/100
|
#164
Average
84.7%
Immigrants | Burma/Myanmar
57.4
/100
|
#165
Average
84.7%
Immigrants | Spain
56.9
/100
|
#166
Average
84.7%