Immigrants from Malaysia vs Guyanese In Labor Force | Age 20-64
COMPARE
Immigrants from Malaysia
Guyanese
In Labor Force | Age 20-64
In Labor Force | Age 20-64 Comparison
Immigrants from Malaysia
Guyanese
80.1%
IN LABOR FORCE | AGE 20-64
95.9/ 100
METRIC RATING
96th/ 347
METRIC RANK
78.1%
IN LABOR FORCE | AGE 20-64
0.0/ 100
METRIC RATING
281st/ 347
METRIC RANK
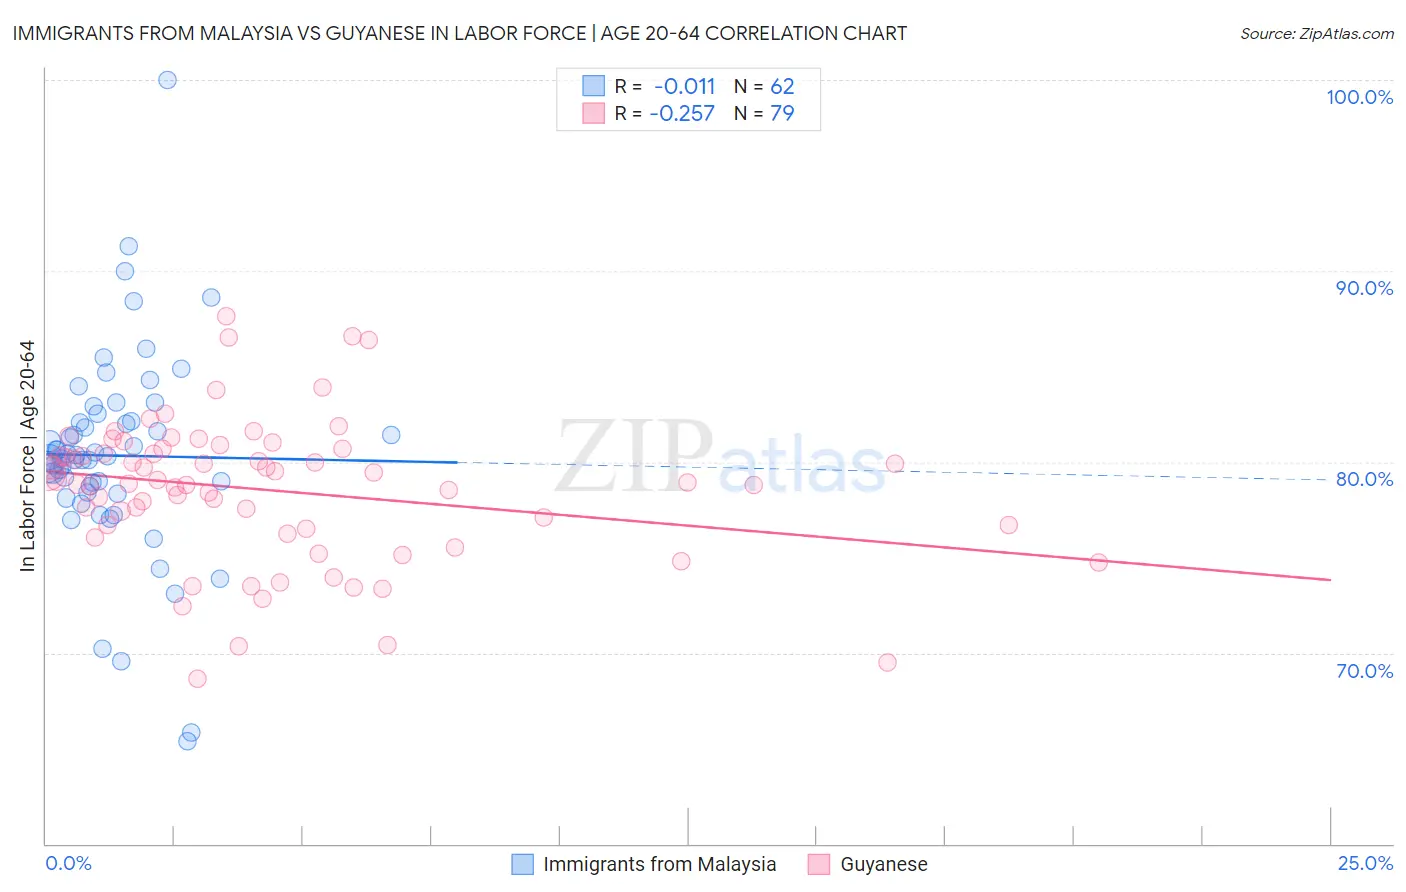
Immigrants from Malaysia vs Guyanese In Labor Force | Age 20-64 Correlation Chart
The statistical analysis conducted on geographies consisting of 197,972,678 people shows no correlation between the proportion of Immigrants from Malaysia and labor force participation rate among population between the ages 20 and 64 in the United States with a correlation coefficient (R) of -0.011 and weighted average of 80.1%. Similarly, the statistical analysis conducted on geographies consisting of 176,938,027 people shows a weak negative correlation between the proportion of Guyanese and labor force participation rate among population between the ages 20 and 64 in the United States with a correlation coefficient (R) of -0.257 and weighted average of 78.1%, a difference of 2.5%.
In Labor Force | Age 20-64 Correlation Summary
| Measurement | Immigrants from Malaysia | Guyanese |
| Minimum | 65.4% | 68.6% |
| Maximum | 100.0% | 87.6% |
| Range | 34.6% | 19.0% |
| Mean | 80.3% | 78.5% |
| Median | 80.3% | 78.9% |
| Interquartile 25% (IQ1) | 78.4% | 76.5% |
| Interquartile 75% (IQ3) | 82.1% | 80.7% |
| Interquartile Range (IQR) | 3.7% | 4.1% |
| Standard Deviation (Sample) | 5.4% | 3.8% |
| Standard Deviation (Population) | 5.4% | 3.7% |
Similar Demographics by In Labor Force | Age 20-64
Demographics Similar to Immigrants from Malaysia by In Labor Force | Age 20-64
In terms of in labor force | age 20-64, the demographic groups most similar to Immigrants from Malaysia are Yugoslavian (80.1%, a difference of 0.0%), South American (80.1%, a difference of 0.0%), Immigrants from Uruguay (80.1%, a difference of 0.0%), Immigrants from Asia (80.1%, a difference of 0.010%), and Immigrants from Chile (80.1%, a difference of 0.010%).
| Demographics | Rating | Rank | In Labor Force | Age 20-64 |
| Immigrants | Venezuela | 96.8 /100 | #89 | Exceptional 80.1% |
| Poles | 96.8 /100 | #90 | Exceptional 80.1% |
| Uruguayans | 96.7 /100 | #91 | Exceptional 80.1% |
| Ghanaians | 96.7 /100 | #92 | Exceptional 80.1% |
| Immigrants | Belarus | 96.4 /100 | #93 | Exceptional 80.1% |
| Immigrants | Asia | 96.0 /100 | #94 | Exceptional 80.1% |
| Yugoslavians | 95.9 /100 | #95 | Exceptional 80.1% |
| Immigrants | Malaysia | 95.9 /100 | #96 | Exceptional 80.1% |
| South Americans | 95.9 /100 | #97 | Exceptional 80.1% |
| Immigrants | Uruguay | 95.8 /100 | #98 | Exceptional 80.1% |
| Immigrants | Chile | 95.7 /100 | #99 | Exceptional 80.1% |
| Filipinos | 95.6 /100 | #100 | Exceptional 80.1% |
| Palestinians | 95.5 /100 | #101 | Exceptional 80.0% |
| Immigrants | Australia | 95.5 /100 | #102 | Exceptional 80.0% |
| Russians | 95.5 /100 | #103 | Exceptional 80.0% |
Demographics Similar to Guyanese by In Labor Force | Age 20-64
In terms of in labor force | age 20-64, the demographic groups most similar to Guyanese are Immigrants from St. Vincent and the Grenadines (78.1%, a difference of 0.020%), Immigrants from Dominica (78.1%, a difference of 0.030%), Nonimmigrants (78.1%, a difference of 0.030%), Immigrants from Guyana (78.1%, a difference of 0.050%), and Belizean (78.2%, a difference of 0.070%).
| Demographics | Rating | Rank | In Labor Force | Age 20-64 |
| Aleuts | 0.0 /100 | #274 | Tragic 78.2% |
| Spanish | 0.0 /100 | #275 | Tragic 78.2% |
| Puget Sound Salish | 0.0 /100 | #276 | Tragic 78.2% |
| Immigrants | Bahamas | 0.0 /100 | #277 | Tragic 78.2% |
| Mexican American Indians | 0.0 /100 | #278 | Tragic 78.2% |
| Belizeans | 0.0 /100 | #279 | Tragic 78.2% |
| Immigrants | Dominica | 0.0 /100 | #280 | Tragic 78.1% |
| Guyanese | 0.0 /100 | #281 | Tragic 78.1% |
| Immigrants | St. Vincent and the Grenadines | 0.0 /100 | #282 | Tragic 78.1% |
| Immigrants | Nonimmigrants | 0.0 /100 | #283 | Tragic 78.1% |
| Immigrants | Guyana | 0.0 /100 | #284 | Tragic 78.1% |
| Osage | 0.0 /100 | #285 | Tragic 78.0% |
| Immigrants | Belize | 0.0 /100 | #286 | Tragic 78.0% |
| Vietnamese | 0.0 /100 | #287 | Tragic 78.0% |
| Hmong | 0.0 /100 | #288 | Tragic 77.9% |