Assyrian/Chaldean/Syriac vs South American In Labor Force | Age > 16
COMPARE
Assyrian/Chaldean/Syriac
South American
In Labor Force | Age > 16
In Labor Force | Age > 16 Comparison
Assyrians/Chaldeans/Syriacs
South Americans
64.0%
IN LABOR FORCE | AGE > 16
0.3/ 100
METRIC RATING
278th/ 347
METRIC RANK
66.0%
IN LABOR FORCE | AGE > 16
99.4/ 100
METRIC RATING
86th/ 347
METRIC RANK
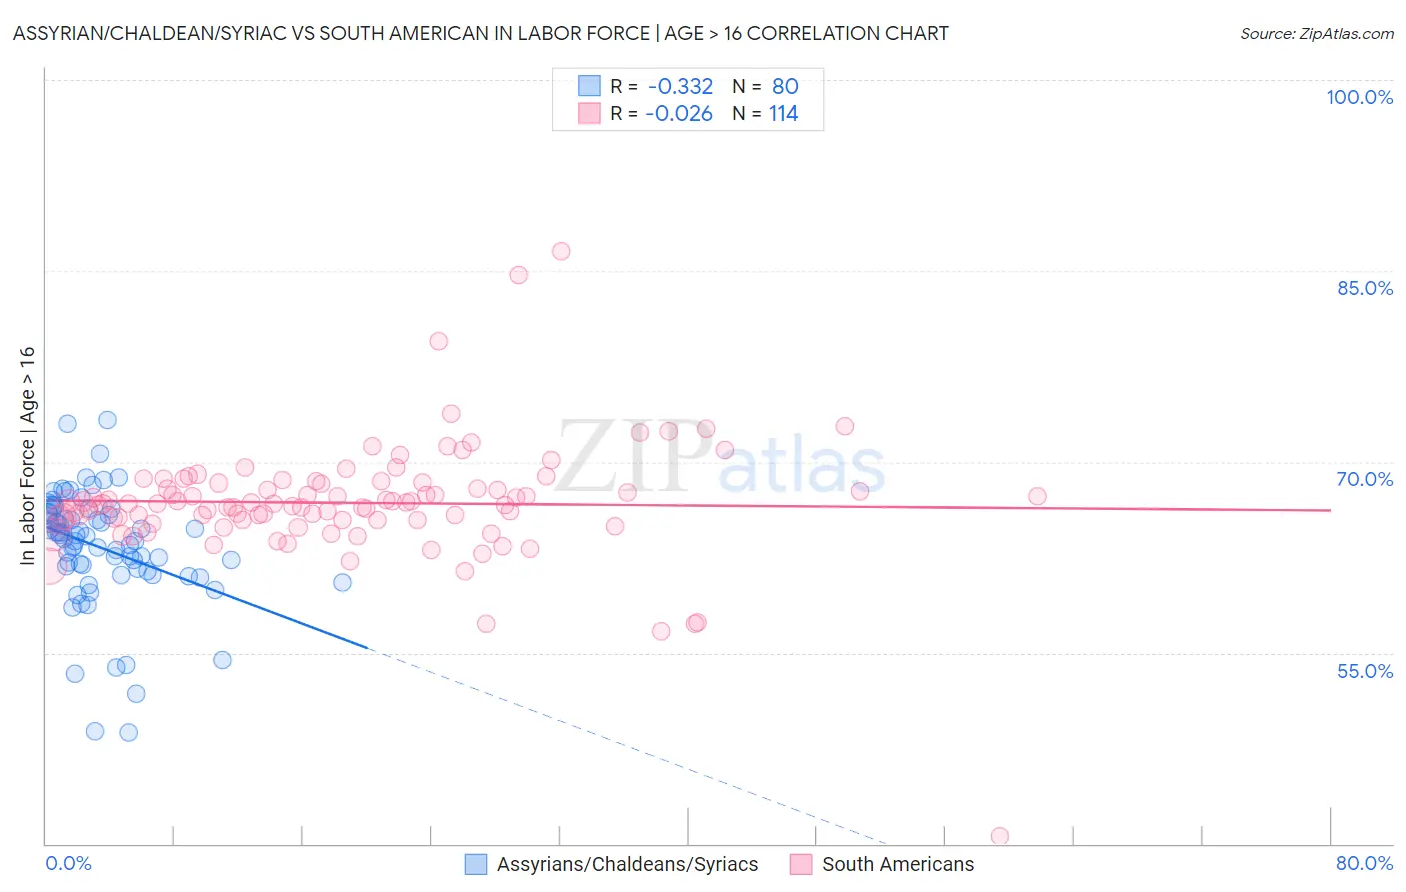
Assyrian/Chaldean/Syriac vs South American In Labor Force | Age > 16 Correlation Chart
The statistical analysis conducted on geographies consisting of 110,318,125 people shows a mild negative correlation between the proportion of Assyrians/Chaldeans/Syriacs and labor force participation rate among population ages 16 and over in the United States with a correlation coefficient (R) of -0.332 and weighted average of 64.0%. Similarly, the statistical analysis conducted on geographies consisting of 494,183,662 people shows no correlation between the proportion of South Americans and labor force participation rate among population ages 16 and over in the United States with a correlation coefficient (R) of -0.026 and weighted average of 66.0%, a difference of 3.1%.
In Labor Force | Age > 16 Correlation Summary
| Measurement | Assyrian/Chaldean/Syriac | South American |
| Minimum | 48.7% | 40.6% |
| Maximum | 73.3% | 86.5% |
| Range | 24.6% | 45.9% |
| Mean | 63.3% | 66.8% |
| Median | 64.1% | 66.7% |
| Interquartile 25% (IQ1) | 61.5% | 65.5% |
| Interquartile 75% (IQ3) | 66.0% | 68.3% |
| Interquartile Range (IQR) | 4.5% | 2.9% |
| Standard Deviation (Sample) | 4.6% | 4.7% |
| Standard Deviation (Population) | 4.6% | 4.7% |
Similar Demographics by In Labor Force | Age > 16
Demographics Similar to Assyrians/Chaldeans/Syriacs by In Labor Force | Age > 16
In terms of in labor force | age > 16, the demographic groups most similar to Assyrians/Chaldeans/Syriacs are Immigrants from Bahamas (64.0%, a difference of 0.020%), Welsh (64.0%, a difference of 0.030%), Immigrants from St. Vincent and the Grenadines (64.0%, a difference of 0.040%), French Canadian (64.0%, a difference of 0.040%), and Mexican (64.1%, a difference of 0.050%).
| Demographics | Rating | Rank | In Labor Force | Age > 16 |
| Dominicans | 0.4 /100 | #271 | Tragic 64.1% |
| Native Hawaiians | 0.3 /100 | #272 | Tragic 64.1% |
| Hmong | 0.3 /100 | #273 | Tragic 64.1% |
| Immigrants | Cuba | 0.3 /100 | #274 | Tragic 64.1% |
| Mexicans | 0.3 /100 | #275 | Tragic 64.1% |
| French American Indians | 0.3 /100 | #276 | Tragic 64.1% |
| Immigrants | Bahamas | 0.3 /100 | #277 | Tragic 64.0% |
| Assyrians/Chaldeans/Syriacs | 0.3 /100 | #278 | Tragic 64.0% |
| Welsh | 0.2 /100 | #279 | Tragic 64.0% |
| Immigrants | St. Vincent and the Grenadines | 0.2 /100 | #280 | Tragic 64.0% |
| French Canadians | 0.2 /100 | #281 | Tragic 64.0% |
| Immigrants | Guyana | 0.2 /100 | #282 | Tragic 64.0% |
| Immigrants | Germany | 0.1 /100 | #283 | Tragic 63.9% |
| French | 0.1 /100 | #284 | Tragic 63.9% |
| Slovaks | 0.1 /100 | #285 | Tragic 63.9% |
Demographics Similar to South Americans by In Labor Force | Age > 16
In terms of in labor force | age > 16, the demographic groups most similar to South Americans are South American Indian (66.0%, a difference of 0.010%), Bermudan (66.0%, a difference of 0.010%), Mongolian (66.1%, a difference of 0.020%), Central American (66.1%, a difference of 0.030%), and German Russian (66.1%, a difference of 0.040%).
| Demographics | Rating | Rank | In Labor Force | Age > 16 |
| Turks | 99.6 /100 | #79 | Exceptional 66.1% |
| Malaysians | 99.6 /100 | #80 | Exceptional 66.1% |
| Moroccans | 99.5 /100 | #81 | Exceptional 66.1% |
| German Russians | 99.4 /100 | #82 | Exceptional 66.1% |
| Immigrants | Jordan | 99.4 /100 | #83 | Exceptional 66.1% |
| Central Americans | 99.4 /100 | #84 | Exceptional 66.1% |
| Mongolians | 99.4 /100 | #85 | Exceptional 66.1% |
| South Americans | 99.4 /100 | #86 | Exceptional 66.0% |
| South American Indians | 99.4 /100 | #87 | Exceptional 66.0% |
| Bermudans | 99.3 /100 | #88 | Exceptional 66.0% |
| Immigrants | Laos | 99.2 /100 | #89 | Exceptional 66.0% |
| Chileans | 99.2 /100 | #90 | Exceptional 66.0% |
| Iranians | 99.2 /100 | #91 | Exceptional 66.0% |
| Aleuts | 99.1 /100 | #92 | Exceptional 66.0% |
| Immigrants | South America | 99.1 /100 | #93 | Exceptional 66.0% |