Assyrian/Chaldean/Syriac vs New Zealander In Labor Force | Age > 16
COMPARE
Assyrian/Chaldean/Syriac
New Zealander
In Labor Force | Age > 16
In Labor Force | Age > 16 Comparison
Assyrians/Chaldeans/Syriacs
New Zealanders
64.0%
IN LABOR FORCE | AGE > 16
0.3/ 100
METRIC RATING
278th/ 347
METRIC RANK
65.7%
IN LABOR FORCE | AGE > 16
96.0/ 100
METRIC RATING
121st/ 347
METRIC RANK
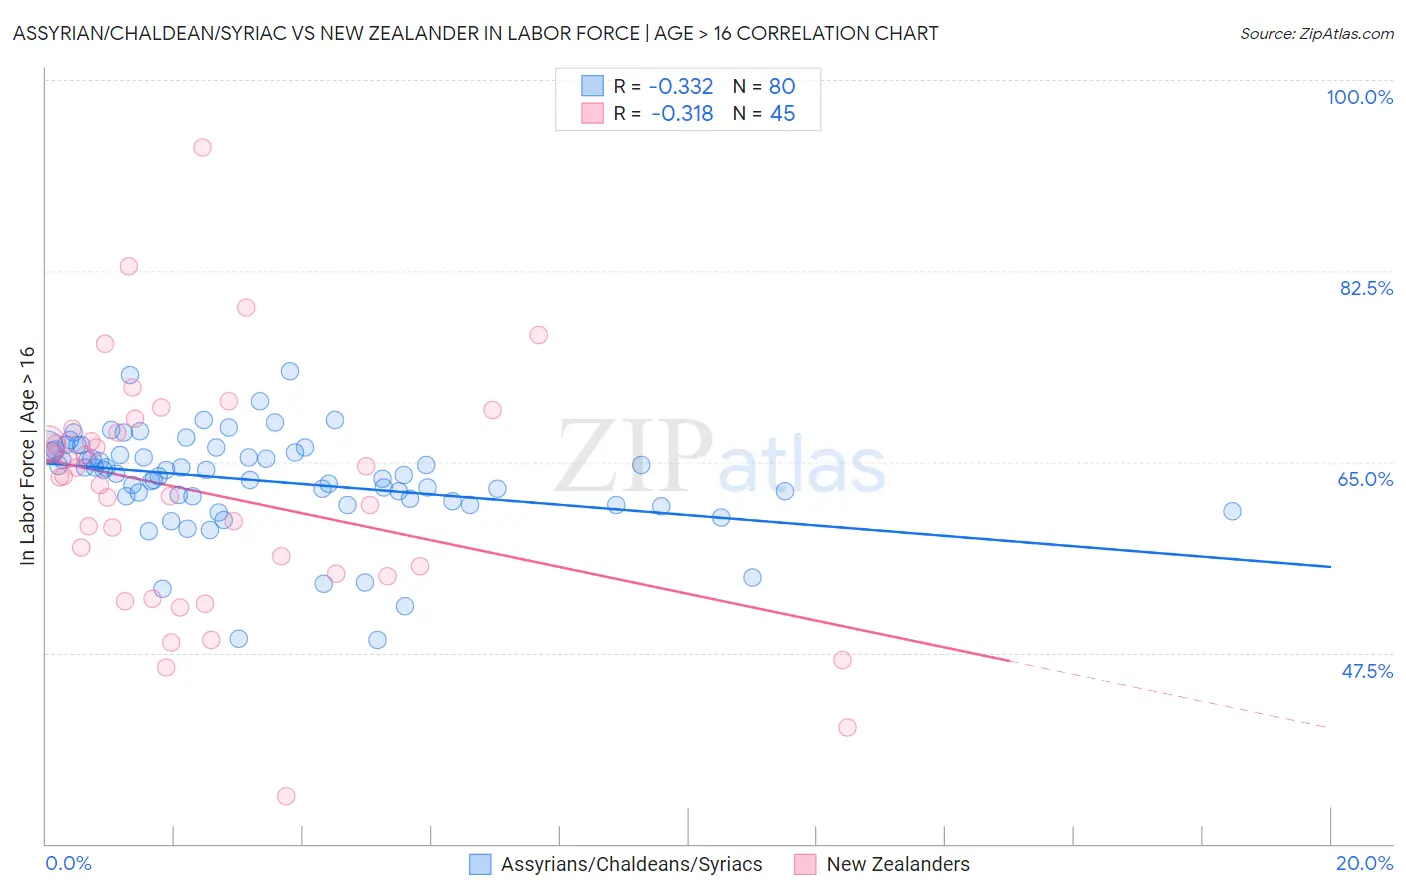
Assyrian/Chaldean/Syriac vs New Zealander In Labor Force | Age > 16 Correlation Chart
The statistical analysis conducted on geographies consisting of 110,318,125 people shows a mild negative correlation between the proportion of Assyrians/Chaldeans/Syriacs and labor force participation rate among population ages 16 and over in the United States with a correlation coefficient (R) of -0.332 and weighted average of 64.0%. Similarly, the statistical analysis conducted on geographies consisting of 106,923,900 people shows a mild negative correlation between the proportion of New Zealanders and labor force participation rate among population ages 16 and over in the United States with a correlation coefficient (R) of -0.318 and weighted average of 65.7%, a difference of 2.6%.
In Labor Force | Age > 16 Correlation Summary
| Measurement | Assyrian/Chaldean/Syriac | New Zealander |
| Minimum | 48.7% | 34.3% |
| Maximum | 73.3% | 93.8% |
| Range | 24.6% | 59.5% |
| Mean | 63.3% | 62.0% |
| Median | 64.1% | 63.6% |
| Interquartile 25% (IQ1) | 61.5% | 54.7% |
| Interquartile 75% (IQ3) | 66.0% | 67.9% |
| Interquartile Range (IQR) | 4.5% | 13.2% |
| Standard Deviation (Sample) | 4.6% | 11.1% |
| Standard Deviation (Population) | 4.6% | 10.9% |
Similar Demographics by In Labor Force | Age > 16
Demographics Similar to Assyrians/Chaldeans/Syriacs by In Labor Force | Age > 16
In terms of in labor force | age > 16, the demographic groups most similar to Assyrians/Chaldeans/Syriacs are Immigrants from Bahamas (64.0%, a difference of 0.020%), Welsh (64.0%, a difference of 0.030%), Immigrants from St. Vincent and the Grenadines (64.0%, a difference of 0.040%), French Canadian (64.0%, a difference of 0.040%), and Mexican (64.1%, a difference of 0.050%).
| Demographics | Rating | Rank | In Labor Force | Age > 16 |
| Dominicans | 0.4 /100 | #271 | Tragic 64.1% |
| Native Hawaiians | 0.3 /100 | #272 | Tragic 64.1% |
| Hmong | 0.3 /100 | #273 | Tragic 64.1% |
| Immigrants | Cuba | 0.3 /100 | #274 | Tragic 64.1% |
| Mexicans | 0.3 /100 | #275 | Tragic 64.1% |
| French American Indians | 0.3 /100 | #276 | Tragic 64.1% |
| Immigrants | Bahamas | 0.3 /100 | #277 | Tragic 64.0% |
| Assyrians/Chaldeans/Syriacs | 0.3 /100 | #278 | Tragic 64.0% |
| Welsh | 0.2 /100 | #279 | Tragic 64.0% |
| Immigrants | St. Vincent and the Grenadines | 0.2 /100 | #280 | Tragic 64.0% |
| French Canadians | 0.2 /100 | #281 | Tragic 64.0% |
| Immigrants | Guyana | 0.2 /100 | #282 | Tragic 64.0% |
| Immigrants | Germany | 0.1 /100 | #283 | Tragic 63.9% |
| French | 0.1 /100 | #284 | Tragic 63.9% |
| Slovaks | 0.1 /100 | #285 | Tragic 63.9% |
Demographics Similar to New Zealanders by In Labor Force | Age > 16
In terms of in labor force | age > 16, the demographic groups most similar to New Zealanders are Immigrants from Ecuador (65.7%, a difference of 0.010%), Immigrants from Hong Kong (65.7%, a difference of 0.020%), Immigrants from France (65.7%, a difference of 0.030%), Immigrants from Iraq (65.7%, a difference of 0.040%), and Iraqi (65.7%, a difference of 0.040%).
| Demographics | Rating | Rank | In Labor Force | Age > 16 |
| Hondurans | 97.1 /100 | #114 | Exceptional 65.8% |
| Immigrants | Indonesia | 96.8 /100 | #115 | Exceptional 65.7% |
| Argentineans | 96.7 /100 | #116 | Exceptional 65.7% |
| Immigrants | Iran | 96.6 /100 | #117 | Exceptional 65.7% |
| Immigrants | Thailand | 96.6 /100 | #118 | Exceptional 65.7% |
| Immigrants | France | 96.4 /100 | #119 | Exceptional 65.7% |
| Immigrants | Hong Kong | 96.2 /100 | #120 | Exceptional 65.7% |
| New Zealanders | 96.0 /100 | #121 | Exceptional 65.7% |
| Immigrants | Ecuador | 95.9 /100 | #122 | Exceptional 65.7% |
| Immigrants | Iraq | 95.5 /100 | #123 | Exceptional 65.7% |
| Iraqis | 95.4 /100 | #124 | Exceptional 65.7% |
| Norwegians | 95.3 /100 | #125 | Exceptional 65.7% |
| Koreans | 95.3 /100 | #126 | Exceptional 65.7% |
| Immigrants | Eastern Asia | 94.9 /100 | #127 | Exceptional 65.7% |
| Ecuadorians | 94.7 /100 | #128 | Exceptional 65.6% |