Assyrian/Chaldean/Syriac vs Yuman In Labor Force | Age 45-54
COMPARE
Assyrian/Chaldean/Syriac
Yuman
In Labor Force | Age 45-54
In Labor Force | Age 45-54 Comparison
Assyrians/Chaldeans/Syriacs
Yuman
83.2%
IN LABOR FORCE | AGE 45-54
91.7/ 100
METRIC RATING
114th/ 347
METRIC RANK
76.3%
IN LABOR FORCE | AGE 45-54
0.0/ 100
METRIC RATING
338th/ 347
METRIC RANK
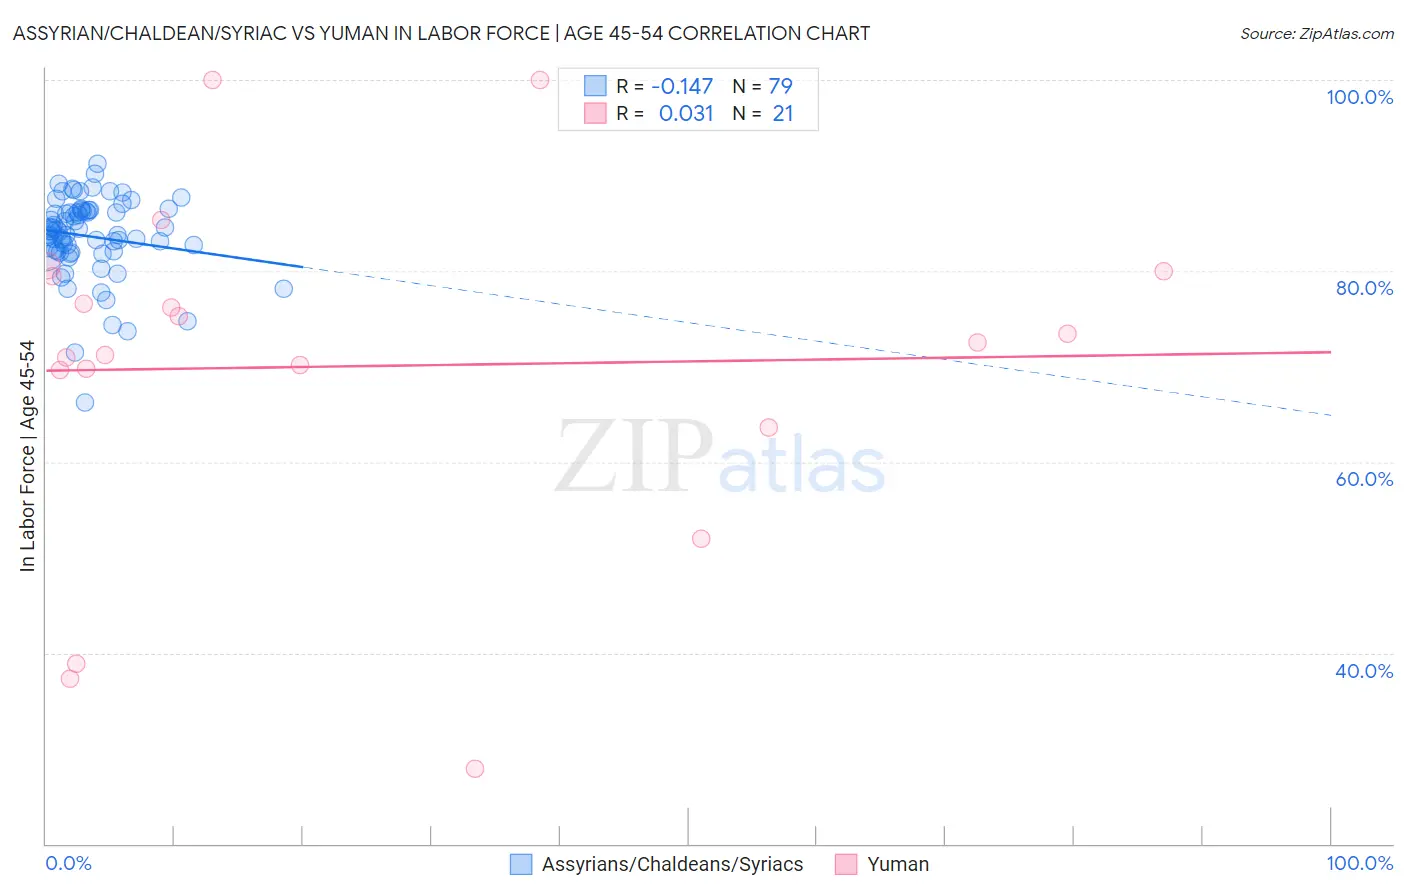
Assyrian/Chaldean/Syriac vs Yuman In Labor Force | Age 45-54 Correlation Chart
The statistical analysis conducted on geographies consisting of 110,290,950 people shows a poor negative correlation between the proportion of Assyrians/Chaldeans/Syriacs and labor force participation rate among population between the ages 45 and 54 in the United States with a correlation coefficient (R) of -0.147 and weighted average of 83.2%. Similarly, the statistical analysis conducted on geographies consisting of 40,663,251 people shows no correlation between the proportion of Yuman and labor force participation rate among population between the ages 45 and 54 in the United States with a correlation coefficient (R) of 0.031 and weighted average of 76.3%, a difference of 9.0%.
In Labor Force | Age 45-54 Correlation Summary
| Measurement | Assyrian/Chaldean/Syriac | Yuman |
| Minimum | 66.2% | 27.8% |
| Maximum | 91.2% | 100.0% |
| Range | 25.0% | 72.2% |
| Mean | 83.6% | 70.0% |
| Median | 84.2% | 72.5% |
| Interquartile 25% (IQ1) | 82.0% | 66.6% |
| Interquartile 75% (IQ3) | 86.3% | 79.7% |
| Interquartile Range (IQR) | 4.3% | 13.1% |
| Standard Deviation (Sample) | 4.2% | 18.2% |
| Standard Deviation (Population) | 4.2% | 17.8% |
Similar Demographics by In Labor Force | Age 45-54
Demographics Similar to Assyrians/Chaldeans/Syriacs by In Labor Force | Age 45-54
In terms of in labor force | age 45-54, the demographic groups most similar to Assyrians/Chaldeans/Syriacs are Immigrants from Albania (83.2%, a difference of 0.0%), Immigrants from Chile (83.2%, a difference of 0.0%), Immigrants from Malaysia (83.2%, a difference of 0.010%), Immigrants from Italy (83.2%, a difference of 0.020%), and Immigrants from Afghanistan (83.2%, a difference of 0.020%).
| Demographics | Rating | Rank | In Labor Force | Age 45-54 |
| Iranians | 92.9 /100 | #107 | Exceptional 83.2% |
| Slovaks | 92.8 /100 | #108 | Exceptional 83.2% |
| Ukrainians | 92.7 /100 | #109 | Exceptional 83.2% |
| Immigrants | Africa | 92.6 /100 | #110 | Exceptional 83.2% |
| Immigrants | Italy | 92.5 /100 | #111 | Exceptional 83.2% |
| Immigrants | Afghanistan | 92.4 /100 | #112 | Exceptional 83.2% |
| Immigrants | Albania | 91.8 /100 | #113 | Exceptional 83.2% |
| Assyrians/Chaldeans/Syriacs | 91.7 /100 | #114 | Exceptional 83.2% |
| Immigrants | Chile | 91.6 /100 | #115 | Exceptional 83.2% |
| Immigrants | Malaysia | 91.4 /100 | #116 | Exceptional 83.2% |
| Immigrants | China | 90.9 /100 | #117 | Exceptional 83.2% |
| Immigrants | Europe | 90.7 /100 | #118 | Exceptional 83.2% |
| Immigrants | Uruguay | 90.2 /100 | #119 | Exceptional 83.2% |
| Immigrants | Russia | 90.1 /100 | #120 | Exceptional 83.2% |
| Uruguayans | 89.4 /100 | #121 | Excellent 83.1% |
Demographics Similar to Yuman by In Labor Force | Age 45-54
In terms of in labor force | age 45-54, the demographic groups most similar to Yuman are Ute (76.6%, a difference of 0.41%), Paiute (76.7%, a difference of 0.47%), Puerto Rican (75.9%, a difference of 0.48%), Lumbee (75.6%, a difference of 0.95%), and Arapaho (77.1%, a difference of 1.0%).
| Demographics | Rating | Rank | In Labor Force | Age 45-54 |
| Tsimshian | 0.0 /100 | #331 | Tragic 77.4% |
| Menominee | 0.0 /100 | #332 | Tragic 77.4% |
| Natives/Alaskans | 0.0 /100 | #333 | Tragic 77.1% |
| Apache | 0.0 /100 | #334 | Tragic 77.1% |
| Arapaho | 0.0 /100 | #335 | Tragic 77.1% |
| Paiute | 0.0 /100 | #336 | Tragic 76.7% |
| Ute | 0.0 /100 | #337 | Tragic 76.6% |
| Yuman | 0.0 /100 | #338 | Tragic 76.3% |
| Puerto Ricans | 0.0 /100 | #339 | Tragic 75.9% |
| Lumbee | 0.0 /100 | #340 | Tragic 75.6% |
| Pueblo | 0.0 /100 | #341 | Tragic 75.5% |
| Tohono O'odham | 0.0 /100 | #342 | Tragic 75.1% |
| Hopi | 0.0 /100 | #343 | Tragic 75.0% |
| Immigrants | Yemen | 0.0 /100 | #344 | Tragic 74.4% |
| Houma | 0.0 /100 | #345 | Tragic 74.1% |