Assyrian/Chaldean/Syriac vs Immigrants from the Azores In Labor Force | Age 35-44
COMPARE
Assyrian/Chaldean/Syriac
Immigrants from the Azores
In Labor Force | Age 35-44
In Labor Force | Age 35-44 Comparison
Assyrians/Chaldeans/Syriacs
Immigrants from the Azores
84.0%
IN LABOR FORCE | AGE 35-44
6.6/ 100
METRIC RATING
222nd/ 347
METRIC RANK
83.6%
IN LABOR FORCE | AGE 35-44
0.3/ 100
METRIC RATING
255th/ 347
METRIC RANK
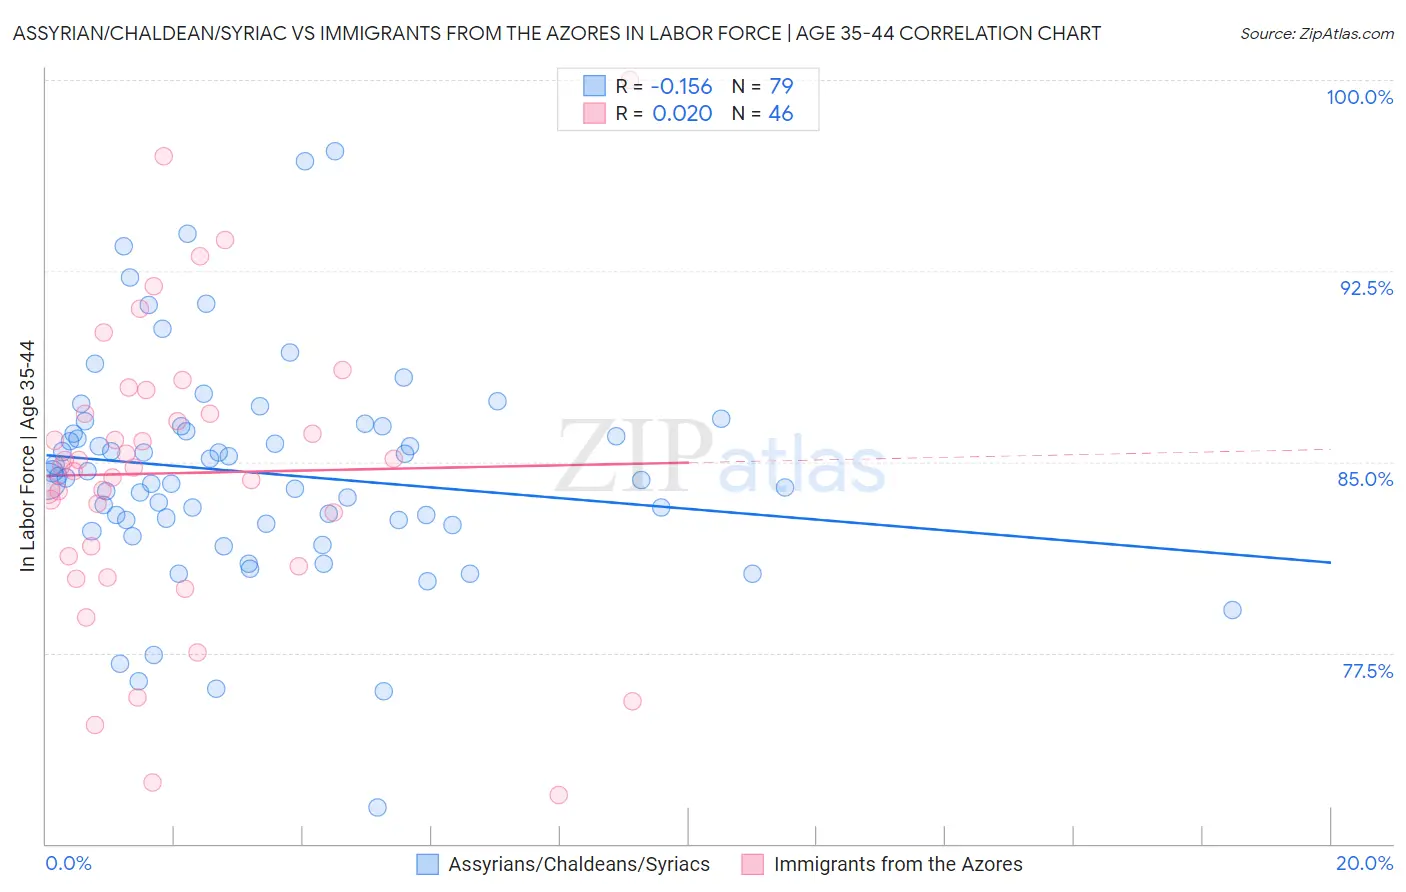
Assyrian/Chaldean/Syriac vs Immigrants from the Azores In Labor Force | Age 35-44 Correlation Chart
The statistical analysis conducted on geographies consisting of 110,311,119 people shows a poor negative correlation between the proportion of Assyrians/Chaldeans/Syriacs and labor force participation rate among population between the ages 35 and 44 in the United States with a correlation coefficient (R) of -0.156 and weighted average of 84.0%. Similarly, the statistical analysis conducted on geographies consisting of 46,255,130 people shows no correlation between the proportion of Immigrants from the Azores and labor force participation rate among population between the ages 35 and 44 in the United States with a correlation coefficient (R) of 0.020 and weighted average of 83.6%, a difference of 0.49%.
In Labor Force | Age 35-44 Correlation Summary
| Measurement | Assyrian/Chaldean/Syriac | Immigrants from the Azores |
| Minimum | 71.4% | 71.9% |
| Maximum | 97.2% | 100.0% |
| Range | 25.8% | 28.1% |
| Mean | 84.5% | 84.6% |
| Median | 84.4% | 84.8% |
| Interquartile 25% (IQ1) | 82.6% | 81.3% |
| Interquartile 75% (IQ3) | 86.4% | 86.9% |
| Interquartile Range (IQR) | 3.8% | 5.6% |
| Standard Deviation (Sample) | 4.3% | 5.8% |
| Standard Deviation (Population) | 4.3% | 5.7% |
Similar Demographics by In Labor Force | Age 35-44
Demographics Similar to Assyrians/Chaldeans/Syriacs by In Labor Force | Age 35-44
In terms of in labor force | age 35-44, the demographic groups most similar to Assyrians/Chaldeans/Syriacs are Icelander (84.0%, a difference of 0.0%), Immigrants from Panama (84.0%, a difference of 0.0%), U.S. Virgin Islander (84.0%, a difference of 0.010%), Immigrants from Burma/Myanmar (84.0%, a difference of 0.010%), and French (84.0%, a difference of 0.020%).
| Demographics | Rating | Rank | In Labor Force | Age 35-44 |
| Europeans | 12.2 /100 | #215 | Poor 84.1% |
| Nicaraguans | 12.1 /100 | #216 | Poor 84.1% |
| Immigrants | Norway | 11.7 /100 | #217 | Poor 84.1% |
| Immigrants | Nicaragua | 9.4 /100 | #218 | Tragic 84.1% |
| Sub-Saharan Africans | 9.3 /100 | #219 | Tragic 84.1% |
| French | 7.5 /100 | #220 | Tragic 84.0% |
| Icelanders | 6.7 /100 | #221 | Tragic 84.0% |
| Assyrians/Chaldeans/Syriacs | 6.6 /100 | #222 | Tragic 84.0% |
| Immigrants | Panama | 6.4 /100 | #223 | Tragic 84.0% |
| U.S. Virgin Islanders | 6.1 /100 | #224 | Tragic 84.0% |
| Immigrants | Burma/Myanmar | 6.1 /100 | #225 | Tragic 84.0% |
| Panamanians | 5.4 /100 | #226 | Tragic 84.0% |
| British West Indians | 5.3 /100 | #227 | Tragic 84.0% |
| Welsh | 5.3 /100 | #228 | Tragic 84.0% |
| Immigrants | Thailand | 4.7 /100 | #229 | Tragic 84.0% |
Demographics Similar to Immigrants from the Azores by In Labor Force | Age 35-44
In terms of in labor force | age 35-44, the demographic groups most similar to Immigrants from the Azores are Japanese (83.6%, a difference of 0.020%), Tongan (83.6%, a difference of 0.030%), Basque (83.6%, a difference of 0.030%), Salvadoran (83.6%, a difference of 0.040%), and Immigrants from Guyana (83.6%, a difference of 0.040%).
| Demographics | Rating | Rank | In Labor Force | Age 35-44 |
| Indonesians | 0.8 /100 | #248 | Tragic 83.7% |
| Immigrants | St. Vincent and the Grenadines | 0.7 /100 | #249 | Tragic 83.7% |
| Whites/Caucasians | 0.5 /100 | #250 | Tragic 83.6% |
| Salvadorans | 0.4 /100 | #251 | Tragic 83.6% |
| Immigrants | Guyana | 0.4 /100 | #252 | Tragic 83.6% |
| Lebanese | 0.4 /100 | #253 | Tragic 83.6% |
| Tongans | 0.4 /100 | #254 | Tragic 83.6% |
| Immigrants | Azores | 0.3 /100 | #255 | Tragic 83.6% |
| Japanese | 0.3 /100 | #256 | Tragic 83.6% |
| Basques | 0.3 /100 | #257 | Tragic 83.6% |
| Tsimshian | 0.2 /100 | #258 | Tragic 83.5% |
| Immigrants | El Salvador | 0.2 /100 | #259 | Tragic 83.5% |
| Vietnamese | 0.2 /100 | #260 | Tragic 83.5% |
| Immigrants | Dominica | 0.2 /100 | #261 | Tragic 83.5% |
| Immigrants | Congo | 0.2 /100 | #262 | Tragic 83.5% |