Asian vs Jamaican In Labor Force | Age 45-54
COMPARE
Asian
Jamaican
In Labor Force | Age 45-54
In Labor Force | Age 45-54 Comparison
Asians
Jamaicans
83.4%
IN LABOR FORCE | AGE 45-54
97.7/ 100
METRIC RATING
66th/ 347
METRIC RANK
82.0%
IN LABOR FORCE | AGE 45-54
1.8/ 100
METRIC RATING
230th/ 347
METRIC RANK
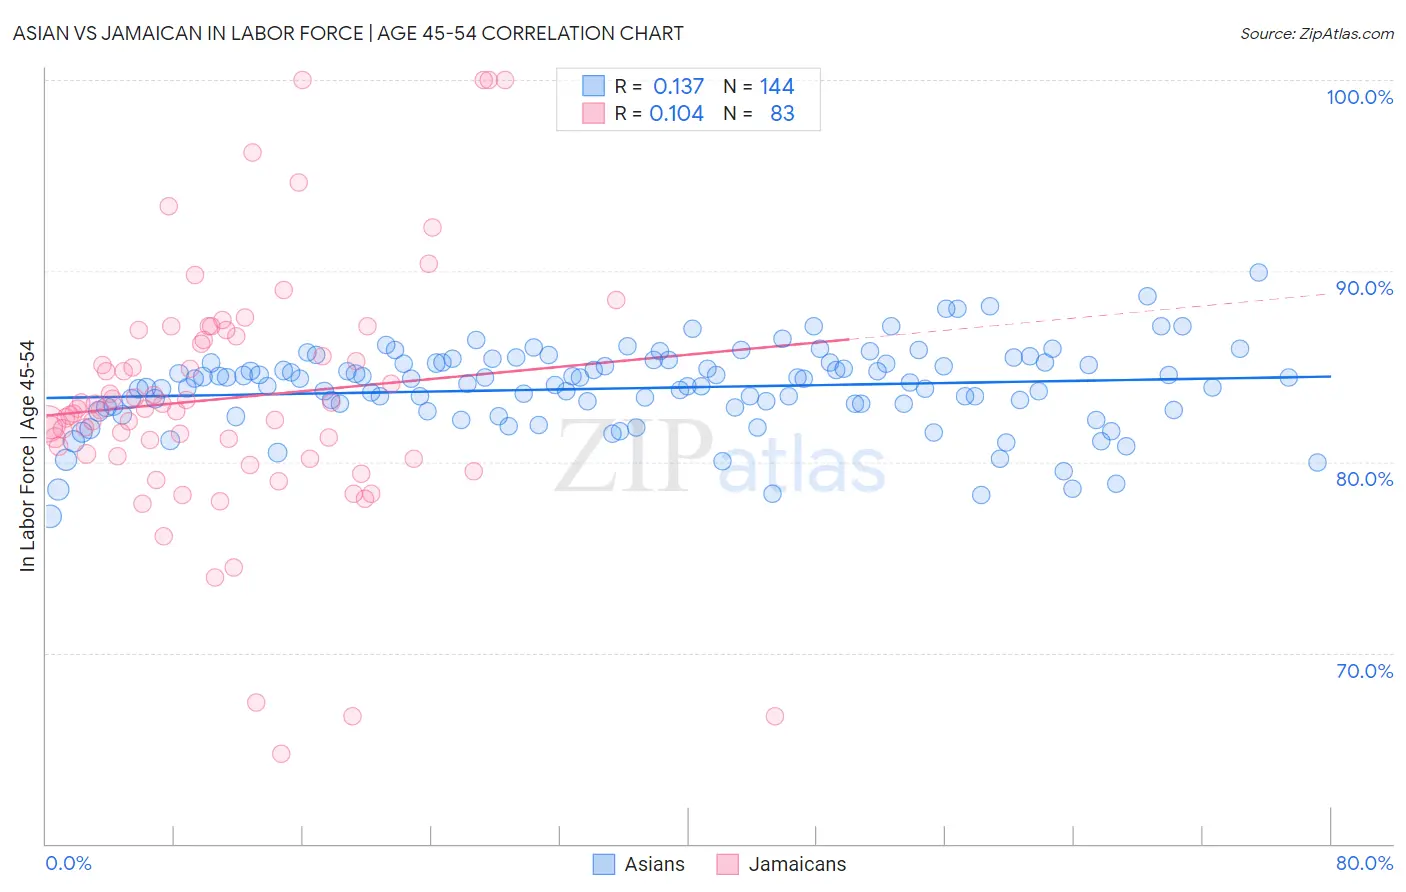
Asian vs Jamaican In Labor Force | Age 45-54 Correlation Chart
The statistical analysis conducted on geographies consisting of 550,172,667 people shows a poor positive correlation between the proportion of Asians and labor force participation rate among population between the ages 45 and 54 in the United States with a correlation coefficient (R) of 0.137 and weighted average of 83.4%. Similarly, the statistical analysis conducted on geographies consisting of 367,644,150 people shows a poor positive correlation between the proportion of Jamaicans and labor force participation rate among population between the ages 45 and 54 in the United States with a correlation coefficient (R) of 0.104 and weighted average of 82.0%, a difference of 1.7%.
In Labor Force | Age 45-54 Correlation Summary
| Measurement | Asian | Jamaican |
| Minimum | 77.1% | 64.7% |
| Maximum | 89.9% | 100.0% |
| Range | 12.8% | 35.3% |
| Mean | 83.9% | 83.3% |
| Median | 84.1% | 82.8% |
| Interquartile 25% (IQ1) | 82.8% | 80.3% |
| Interquartile 75% (IQ3) | 85.2% | 86.6% |
| Interquartile Range (IQR) | 2.3% | 6.3% |
| Standard Deviation (Sample) | 2.2% | 6.6% |
| Standard Deviation (Population) | 2.2% | 6.6% |
Similar Demographics by In Labor Force | Age 45-54
Demographics Similar to Asians by In Labor Force | Age 45-54
In terms of in labor force | age 45-54, the demographic groups most similar to Asians are Chilean (83.4%, a difference of 0.0%), Egyptian (83.5%, a difference of 0.010%), Afghan (83.5%, a difference of 0.020%), Immigrants from Kenya (83.5%, a difference of 0.020%), and Immigrants from Colombia (83.4%, a difference of 0.020%).
| Demographics | Rating | Rank | In Labor Force | Age 45-54 |
| Bhutanese | 98.3 /100 | #59 | Exceptional 83.5% |
| Carpatho Rusyns | 98.3 /100 | #60 | Exceptional 83.5% |
| Filipinos | 98.3 /100 | #61 | Exceptional 83.5% |
| Immigrants | Taiwan | 98.0 /100 | #62 | Exceptional 83.5% |
| Afghans | 97.9 /100 | #63 | Exceptional 83.5% |
| Immigrants | Kenya | 97.9 /100 | #64 | Exceptional 83.5% |
| Egyptians | 97.9 /100 | #65 | Exceptional 83.5% |
| Asians | 97.7 /100 | #66 | Exceptional 83.4% |
| Chileans | 97.7 /100 | #67 | Exceptional 83.4% |
| Immigrants | Colombia | 97.6 /100 | #68 | Exceptional 83.4% |
| Taiwanese | 97.5 /100 | #69 | Exceptional 83.4% |
| Immigrants | Latvia | 97.4 /100 | #70 | Exceptional 83.4% |
| Colombians | 97.3 /100 | #71 | Exceptional 83.4% |
| Serbians | 97.2 /100 | #72 | Exceptional 83.4% |
| Immigrants | Czechoslovakia | 97.1 /100 | #73 | Exceptional 83.4% |
Demographics Similar to Jamaicans by In Labor Force | Age 45-54
In terms of in labor force | age 45-54, the demographic groups most similar to Jamaicans are Immigrants from Burma/Myanmar (82.0%, a difference of 0.010%), Immigrants from Senegal (82.0%, a difference of 0.010%), Immigrants from Portugal (82.0%, a difference of 0.020%), Malaysian (82.0%, a difference of 0.020%), and Salvadoran (82.0%, a difference of 0.020%).
| Demographics | Rating | Rank | In Labor Force | Age 45-54 |
| Immigrants | Immigrants | 3.1 /100 | #223 | Tragic 82.1% |
| Immigrants | Jamaica | 2.7 /100 | #224 | Tragic 82.1% |
| Immigrants | Oceania | 2.5 /100 | #225 | Tragic 82.1% |
| Immigrants | Caribbean | 2.5 /100 | #226 | Tragic 82.1% |
| Immigrants | Germany | 2.4 /100 | #227 | Tragic 82.1% |
| Cape Verdeans | 2.1 /100 | #228 | Tragic 82.1% |
| Immigrants | Burma/Myanmar | 1.9 /100 | #229 | Tragic 82.0% |
| Jamaicans | 1.8 /100 | #230 | Tragic 82.0% |
| Immigrants | Senegal | 1.7 /100 | #231 | Tragic 82.0% |
| Immigrants | Portugal | 1.7 /100 | #232 | Tragic 82.0% |
| Malaysians | 1.7 /100 | #233 | Tragic 82.0% |
| Salvadorans | 1.7 /100 | #234 | Tragic 82.0% |
| Sub-Saharan Africans | 1.2 /100 | #235 | Tragic 82.0% |
| Basques | 1.2 /100 | #236 | Tragic 82.0% |
| Immigrants | Trinidad and Tobago | 1.2 /100 | #237 | Tragic 82.0% |