Turkish vs Immigrants from Belarus In Labor Force | Age 20-24
COMPARE
Turkish
Immigrants from Belarus
In Labor Force | Age 20-24
In Labor Force | Age 20-24 Comparison
Turks
Immigrants from Belarus
73.9%
IN LABOR FORCE | AGE 20-24
1.8/ 100
METRIC RATING
245th/ 347
METRIC RANK
73.0%
IN LABOR FORCE | AGE 20-24
0.1/ 100
METRIC RATING
290th/ 347
METRIC RANK
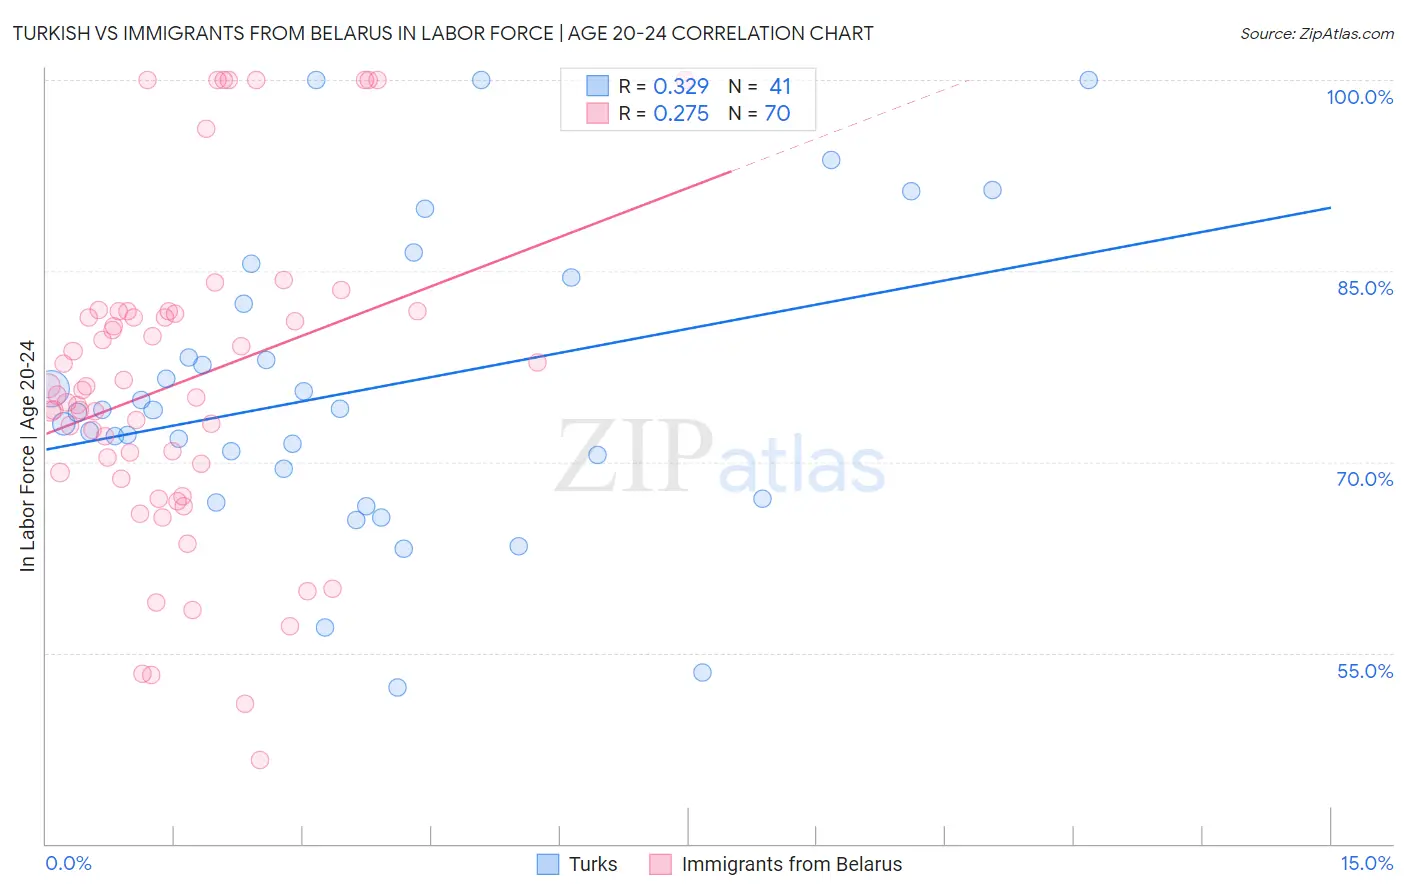
Turkish vs Immigrants from Belarus In Labor Force | Age 20-24 Correlation Chart
The statistical analysis conducted on geographies consisting of 271,784,032 people shows a mild positive correlation between the proportion of Turks and labor force participation rate among population between the ages 20 and 24 in the United States with a correlation coefficient (R) of 0.329 and weighted average of 73.9%. Similarly, the statistical analysis conducted on geographies consisting of 150,196,069 people shows a weak positive correlation between the proportion of Immigrants from Belarus and labor force participation rate among population between the ages 20 and 24 in the United States with a correlation coefficient (R) of 0.275 and weighted average of 73.0%, a difference of 1.3%.
In Labor Force | Age 20-24 Correlation Summary
| Measurement | Turkish | Immigrants from Belarus |
| Minimum | 52.3% | 46.6% |
| Maximum | 100.0% | 100.0% |
| Range | 47.7% | 53.4% |
| Mean | 75.7% | 76.3% |
| Median | 74.1% | 75.4% |
| Interquartile 25% (IQ1) | 68.3% | 69.2% |
| Interquartile 75% (IQ3) | 83.5% | 81.8% |
| Interquartile Range (IQR) | 15.2% | 12.6% |
| Standard Deviation (Sample) | 11.7% | 12.7% |
| Standard Deviation (Population) | 11.5% | 12.6% |
Similar Demographics by In Labor Force | Age 20-24
Demographics Similar to Turks by In Labor Force | Age 20-24
In terms of in labor force | age 20-24, the demographic groups most similar to Turks are Immigrants from Syria (74.0%, a difference of 0.030%), Immigrants from South Central Asia (74.0%, a difference of 0.030%), Immigrants from Panama (73.9%, a difference of 0.040%), Thai (74.0%, a difference of 0.060%), and Immigrants from Senegal (74.0%, a difference of 0.070%).
| Demographics | Rating | Rank | In Labor Force | Age 20-24 |
| Immigrants | Japan | 3.0 /100 | #238 | Tragic 74.1% |
| Immigrants | Latin America | 2.7 /100 | #239 | Tragic 74.1% |
| Immigrants | Sri Lanka | 2.3 /100 | #240 | Tragic 74.0% |
| Immigrants | Senegal | 2.1 /100 | #241 | Tragic 74.0% |
| Thais | 2.1 /100 | #242 | Tragic 74.0% |
| Immigrants | Syria | 1.9 /100 | #243 | Tragic 74.0% |
| Immigrants | South Central Asia | 1.9 /100 | #244 | Tragic 74.0% |
| Turks | 1.8 /100 | #245 | Tragic 73.9% |
| Immigrants | Panama | 1.6 /100 | #246 | Tragic 73.9% |
| Colville | 1.5 /100 | #247 | Tragic 73.9% |
| Immigrants | Saudi Arabia | 1.5 /100 | #248 | Tragic 73.9% |
| Blacks/African Americans | 1.3 /100 | #249 | Tragic 73.9% |
| Immigrants | Belgium | 1.3 /100 | #250 | Tragic 73.9% |
| Immigrants | Egypt | 1.2 /100 | #251 | Tragic 73.8% |
| Immigrants | Kazakhstan | 1.1 /100 | #252 | Tragic 73.8% |
Demographics Similar to Immigrants from Belarus by In Labor Force | Age 20-24
In terms of in labor force | age 20-24, the demographic groups most similar to Immigrants from Belarus are U.S. Virgin Islander (73.0%, a difference of 0.080%), Immigrants from Nicaragua (72.9%, a difference of 0.080%), Argentinean (73.1%, a difference of 0.11%), Pueblo (72.9%, a difference of 0.17%), and Immigrants from Korea (73.1%, a difference of 0.19%).
| Demographics | Rating | Rank | In Labor Force | Age 20-24 |
| Immigrants | Bahamas | 0.1 /100 | #283 | Tragic 73.2% |
| Kiowa | 0.1 /100 | #284 | Tragic 73.2% |
| Nicaraguans | 0.1 /100 | #285 | Tragic 73.2% |
| Immigrants | Lebanon | 0.1 /100 | #286 | Tragic 73.1% |
| Immigrants | Korea | 0.1 /100 | #287 | Tragic 73.1% |
| Argentineans | 0.1 /100 | #288 | Tragic 73.1% |
| U.S. Virgin Islanders | 0.1 /100 | #289 | Tragic 73.0% |
| Immigrants | Belarus | 0.1 /100 | #290 | Tragic 73.0% |
| Immigrants | Nicaragua | 0.0 /100 | #291 | Tragic 72.9% |
| Pueblo | 0.0 /100 | #292 | Tragic 72.9% |
| Immigrants | Belize | 0.0 /100 | #293 | Tragic 72.8% |
| Immigrants | Argentina | 0.0 /100 | #294 | Tragic 72.8% |
| Okinawans | 0.0 /100 | #295 | Tragic 72.7% |
| Jamaicans | 0.0 /100 | #296 | Tragic 72.7% |
| Central American Indians | 0.0 /100 | #297 | Tragic 72.7% |