Immigrants from Brazil vs Immigrants from Belarus In Labor Force | Age 20-24
COMPARE
Immigrants from Brazil
Immigrants from Belarus
In Labor Force | Age 20-24
In Labor Force | Age 20-24 Comparison
Immigrants from Brazil
Immigrants from Belarus
75.5%
IN LABOR FORCE | AGE 20-24
84.8/ 100
METRIC RATING
136th/ 347
METRIC RANK
73.0%
IN LABOR FORCE | AGE 20-24
0.1/ 100
METRIC RATING
290th/ 347
METRIC RANK
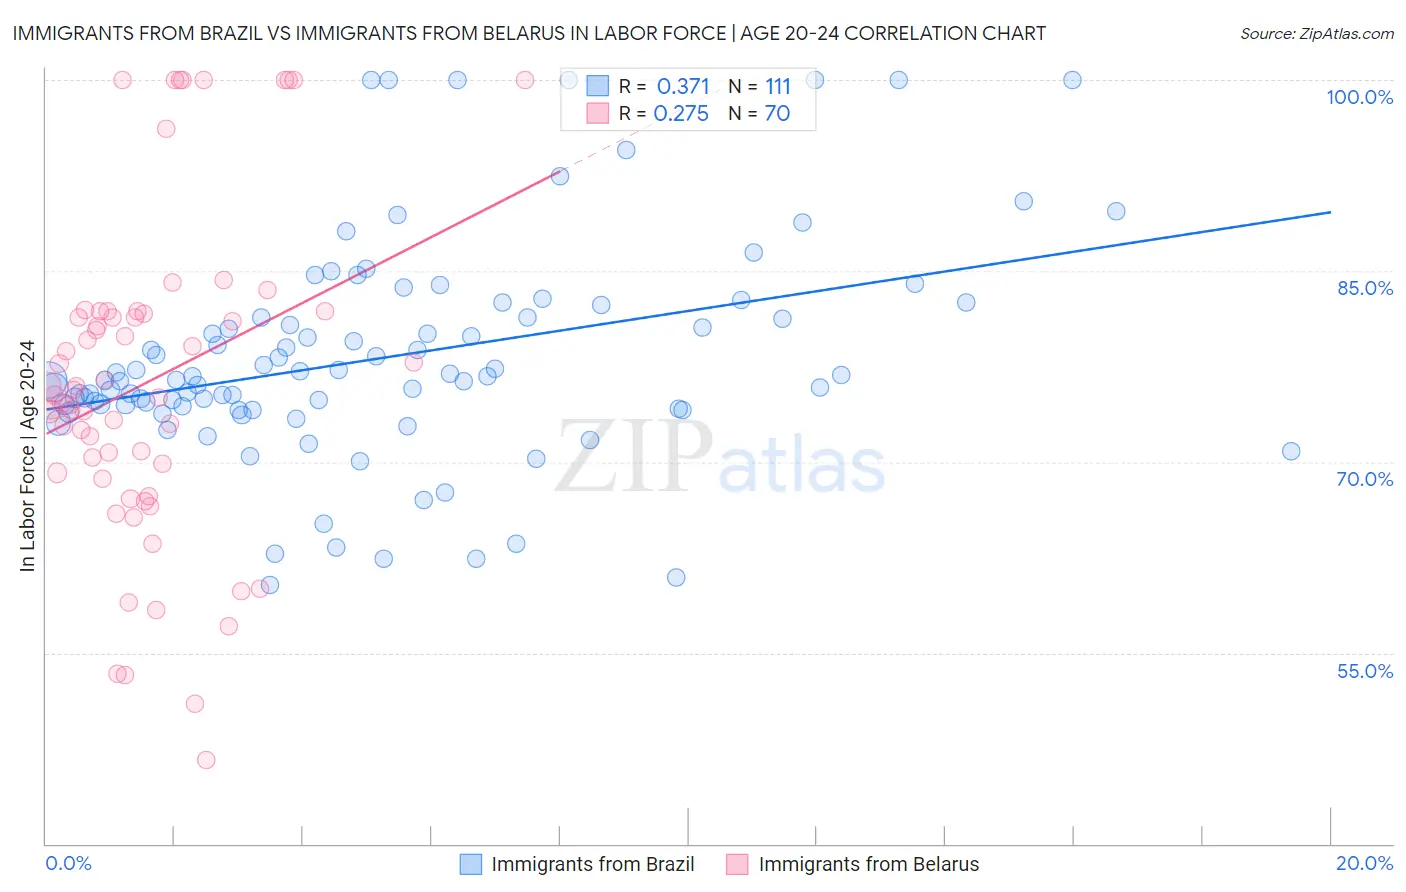
Immigrants from Brazil vs Immigrants from Belarus In Labor Force | Age 20-24 Correlation Chart
The statistical analysis conducted on geographies consisting of 342,949,141 people shows a mild positive correlation between the proportion of Immigrants from Brazil and labor force participation rate among population between the ages 20 and 24 in the United States with a correlation coefficient (R) of 0.371 and weighted average of 75.5%. Similarly, the statistical analysis conducted on geographies consisting of 150,196,069 people shows a weak positive correlation between the proportion of Immigrants from Belarus and labor force participation rate among population between the ages 20 and 24 in the United States with a correlation coefficient (R) of 0.275 and weighted average of 73.0%, a difference of 3.5%.
In Labor Force | Age 20-24 Correlation Summary
| Measurement | Immigrants from Brazil | Immigrants from Belarus |
| Minimum | 60.3% | 46.6% |
| Maximum | 100.0% | 100.0% |
| Range | 39.7% | 53.4% |
| Mean | 78.2% | 76.3% |
| Median | 76.4% | 75.4% |
| Interquartile 25% (IQ1) | 74.2% | 69.2% |
| Interquartile 75% (IQ3) | 81.3% | 81.8% |
| Interquartile Range (IQR) | 7.1% | 12.6% |
| Standard Deviation (Sample) | 8.5% | 12.7% |
| Standard Deviation (Population) | 8.5% | 12.6% |
Similar Demographics by In Labor Force | Age 20-24
Demographics Similar to Immigrants from Brazil by In Labor Force | Age 20-24
In terms of in labor force | age 20-24, the demographic groups most similar to Immigrants from Brazil are Jordanian (75.5%, a difference of 0.0%), Australian (75.5%, a difference of 0.0%), Immigrants from England (75.5%, a difference of 0.010%), Delaware (75.5%, a difference of 0.010%), and Yaqui (75.5%, a difference of 0.020%).
| Demographics | Rating | Rank | In Labor Force | Age 20-24 |
| Iroquois | 89.1 /100 | #129 | Excellent 75.6% |
| Immigrants | Austria | 88.8 /100 | #130 | Excellent 75.6% |
| Immigrants | Jordan | 88.5 /100 | #131 | Excellent 75.6% |
| Palestinians | 88.4 /100 | #132 | Excellent 75.6% |
| Zimbabweans | 88.2 /100 | #133 | Excellent 75.6% |
| Estonians | 87.1 /100 | #134 | Excellent 75.6% |
| Yaqui | 85.5 /100 | #135 | Excellent 75.5% |
| Immigrants | Brazil | 84.8 /100 | #136 | Excellent 75.5% |
| Jordanians | 84.8 /100 | #137 | Excellent 75.5% |
| Australians | 84.8 /100 | #138 | Excellent 75.5% |
| Immigrants | England | 84.6 /100 | #139 | Excellent 75.5% |
| Delaware | 84.5 /100 | #140 | Excellent 75.5% |
| Romanians | 84.1 /100 | #141 | Excellent 75.5% |
| Blackfeet | 83.6 /100 | #142 | Excellent 75.5% |
| Spaniards | 82.0 /100 | #143 | Excellent 75.5% |
Demographics Similar to Immigrants from Belarus by In Labor Force | Age 20-24
In terms of in labor force | age 20-24, the demographic groups most similar to Immigrants from Belarus are U.S. Virgin Islander (73.0%, a difference of 0.080%), Immigrants from Nicaragua (72.9%, a difference of 0.080%), Argentinean (73.1%, a difference of 0.11%), Pueblo (72.9%, a difference of 0.17%), and Immigrants from Korea (73.1%, a difference of 0.19%).
| Demographics | Rating | Rank | In Labor Force | Age 20-24 |
| Immigrants | Bahamas | 0.1 /100 | #283 | Tragic 73.2% |
| Kiowa | 0.1 /100 | #284 | Tragic 73.2% |
| Nicaraguans | 0.1 /100 | #285 | Tragic 73.2% |
| Immigrants | Lebanon | 0.1 /100 | #286 | Tragic 73.1% |
| Immigrants | Korea | 0.1 /100 | #287 | Tragic 73.1% |
| Argentineans | 0.1 /100 | #288 | Tragic 73.1% |
| U.S. Virgin Islanders | 0.1 /100 | #289 | Tragic 73.0% |
| Immigrants | Belarus | 0.1 /100 | #290 | Tragic 73.0% |
| Immigrants | Nicaragua | 0.0 /100 | #291 | Tragic 72.9% |
| Pueblo | 0.0 /100 | #292 | Tragic 72.9% |
| Immigrants | Belize | 0.0 /100 | #293 | Tragic 72.8% |
| Immigrants | Argentina | 0.0 /100 | #294 | Tragic 72.8% |
| Okinawans | 0.0 /100 | #295 | Tragic 72.7% |
| Jamaicans | 0.0 /100 | #296 | Tragic 72.7% |
| Central American Indians | 0.0 /100 | #297 | Tragic 72.7% |