Arab vs Immigrants from Afghanistan In Labor Force | Age 20-24
COMPARE
Arab
Immigrants from Afghanistan
In Labor Force | Age 20-24
In Labor Force | Age 20-24 Comparison
Arabs
Immigrants from Afghanistan
74.6%
IN LABOR FORCE | AGE 20-24
15.8/ 100
METRIC RATING
209th/ 347
METRIC RANK
75.6%
IN LABOR FORCE | AGE 20-24
89.4/ 100
METRIC RATING
128th/ 347
METRIC RANK
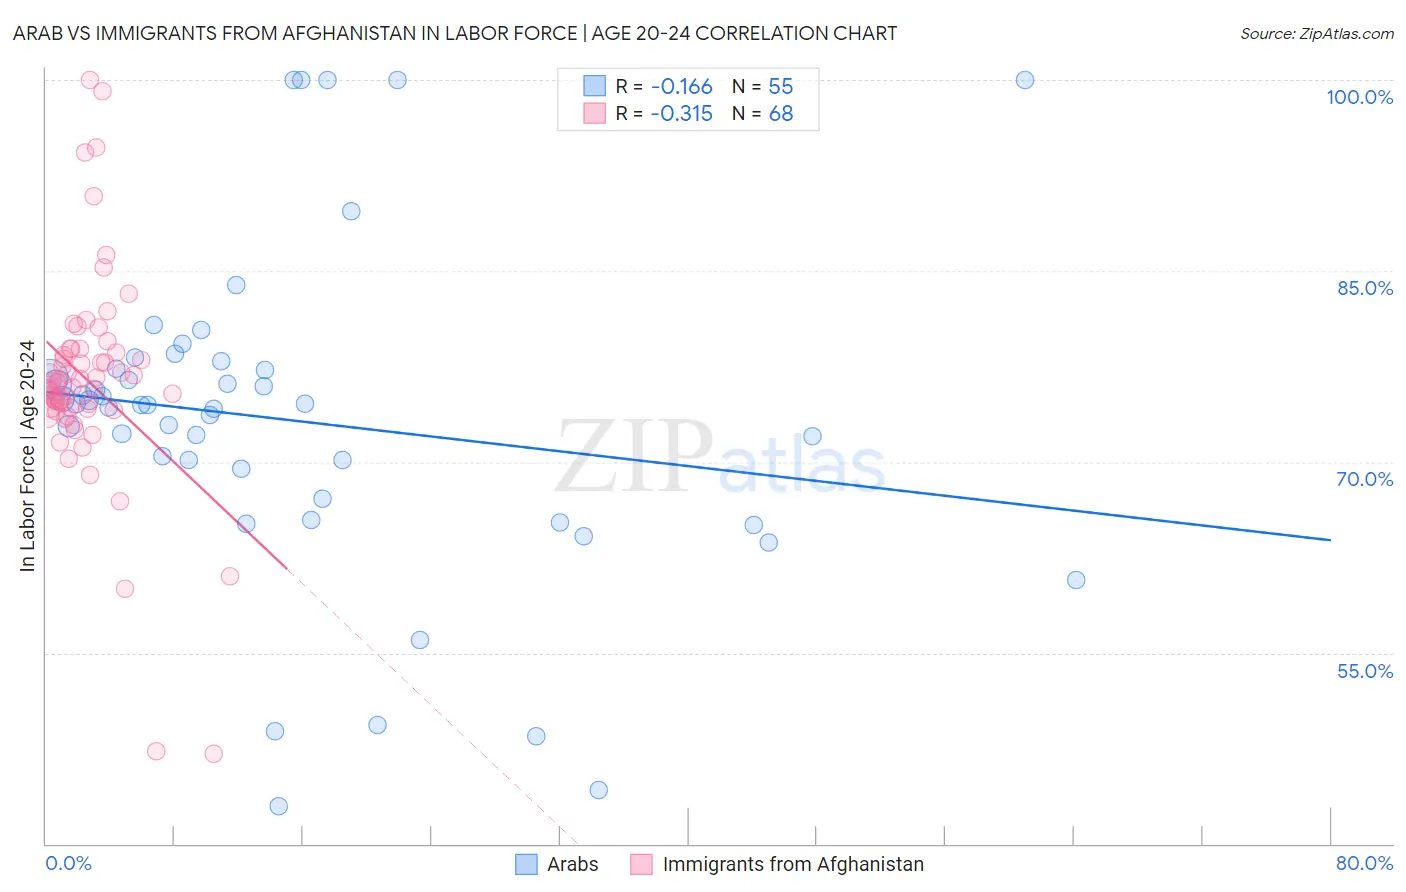
Arab vs Immigrants from Afghanistan In Labor Force | Age 20-24 Correlation Chart
The statistical analysis conducted on geographies consisting of 486,568,832 people shows a poor negative correlation between the proportion of Arabs and labor force participation rate among population between the ages 20 and 24 in the United States with a correlation coefficient (R) of -0.166 and weighted average of 74.6%. Similarly, the statistical analysis conducted on geographies consisting of 147,610,096 people shows a mild negative correlation between the proportion of Immigrants from Afghanistan and labor force participation rate among population between the ages 20 and 24 in the United States with a correlation coefficient (R) of -0.315 and weighted average of 75.6%, a difference of 1.4%.
In Labor Force | Age 20-24 Correlation Summary
| Measurement | Arab | Immigrants from Afghanistan |
| Minimum | 42.9% | 47.1% |
| Maximum | 100.0% | 100.0% |
| Range | 57.1% | 52.9% |
| Mean | 73.2% | 76.4% |
| Median | 74.5% | 76.2% |
| Interquartile 25% (IQ1) | 67.1% | 74.2% |
| Interquartile 75% (IQ3) | 77.3% | 78.7% |
| Interquartile Range (IQR) | 10.2% | 4.6% |
| Standard Deviation (Sample) | 12.8% | 8.5% |
| Standard Deviation (Population) | 12.7% | 8.5% |
Similar Demographics by In Labor Force | Age 20-24
Demographics Similar to Arabs by In Labor Force | Age 20-24
In terms of in labor force | age 20-24, the demographic groups most similar to Arabs are Immigrants from Uruguay (74.6%, a difference of 0.0%), Albanian (74.6%, a difference of 0.010%), Uruguayan (74.6%, a difference of 0.020%), Immigrants from Australia (74.6%, a difference of 0.030%), and Sioux (74.6%, a difference of 0.040%).
| Demographics | Rating | Rank | In Labor Force | Age 20-24 |
| Moroccans | 20.4 /100 | #202 | Fair 74.7% |
| Immigrants | Northern Africa | 17.9 /100 | #203 | Poor 74.6% |
| Immigrants | Italy | 17.6 /100 | #204 | Poor 74.6% |
| Inupiat | 17.6 /100 | #205 | Poor 74.6% |
| Sioux | 17.5 /100 | #206 | Poor 74.6% |
| Albanians | 16.2 /100 | #207 | Poor 74.6% |
| Immigrants | Uruguay | 15.8 /100 | #208 | Poor 74.6% |
| Arabs | 15.8 /100 | #209 | Poor 74.6% |
| Uruguayans | 15.1 /100 | #210 | Poor 74.6% |
| Immigrants | Australia | 14.7 /100 | #211 | Poor 74.6% |
| Creek | 13.3 /100 | #212 | Poor 74.5% |
| Peruvians | 13.3 /100 | #213 | Poor 74.5% |
| Immigrants | Southern Europe | 13.2 /100 | #214 | Poor 74.5% |
| Immigrants | Ghana | 12.7 /100 | #215 | Poor 74.5% |
| Immigrants | Kuwait | 12.7 /100 | #216 | Poor 74.5% |
Demographics Similar to Immigrants from Afghanistan by In Labor Force | Age 20-24
In terms of in labor force | age 20-24, the demographic groups most similar to Immigrants from Afghanistan are Iroquois (75.6%, a difference of 0.010%), Immigrants from Austria (75.6%, a difference of 0.020%), Immigrants from Jordan (75.6%, a difference of 0.030%), Palestinian (75.6%, a difference of 0.040%), and Zimbabwean (75.6%, a difference of 0.040%).
| Demographics | Rating | Rank | In Labor Force | Age 20-24 |
| Immigrants | Serbia | 94.3 /100 | #121 | Exceptional 75.8% |
| Pakistanis | 94.1 /100 | #122 | Exceptional 75.8% |
| Immigrants | Bulgaria | 94.1 /100 | #123 | Exceptional 75.8% |
| Immigrants | Sierra Leone | 93.8 /100 | #124 | Exceptional 75.8% |
| Immigrants | Scotland | 93.7 /100 | #125 | Exceptional 75.8% |
| Brazilians | 93.0 /100 | #126 | Exceptional 75.8% |
| Sub-Saharan Africans | 90.9 /100 | #127 | Exceptional 75.7% |
| Immigrants | Afghanistan | 89.4 /100 | #128 | Excellent 75.6% |
| Iroquois | 89.1 /100 | #129 | Excellent 75.6% |
| Immigrants | Austria | 88.8 /100 | #130 | Excellent 75.6% |
| Immigrants | Jordan | 88.5 /100 | #131 | Excellent 75.6% |
| Palestinians | 88.4 /100 | #132 | Excellent 75.6% |
| Zimbabweans | 88.2 /100 | #133 | Excellent 75.6% |
| Estonians | 87.1 /100 | #134 | Excellent 75.6% |
| Yaqui | 85.5 /100 | #135 | Excellent 75.5% |