Apache vs Swedish In Labor Force | Age 25-29
COMPARE
Apache
Swedish
In Labor Force | Age 25-29
In Labor Force | Age 25-29 Comparison
Apache
Swedes
79.2%
IN LABOR FORCE | AGE 25-29
0.0/ 100
METRIC RATING
336th/ 347
METRIC RANK
85.6%
IN LABOR FORCE | AGE 25-29
99.8/ 100
METRIC RATING
49th/ 347
METRIC RANK
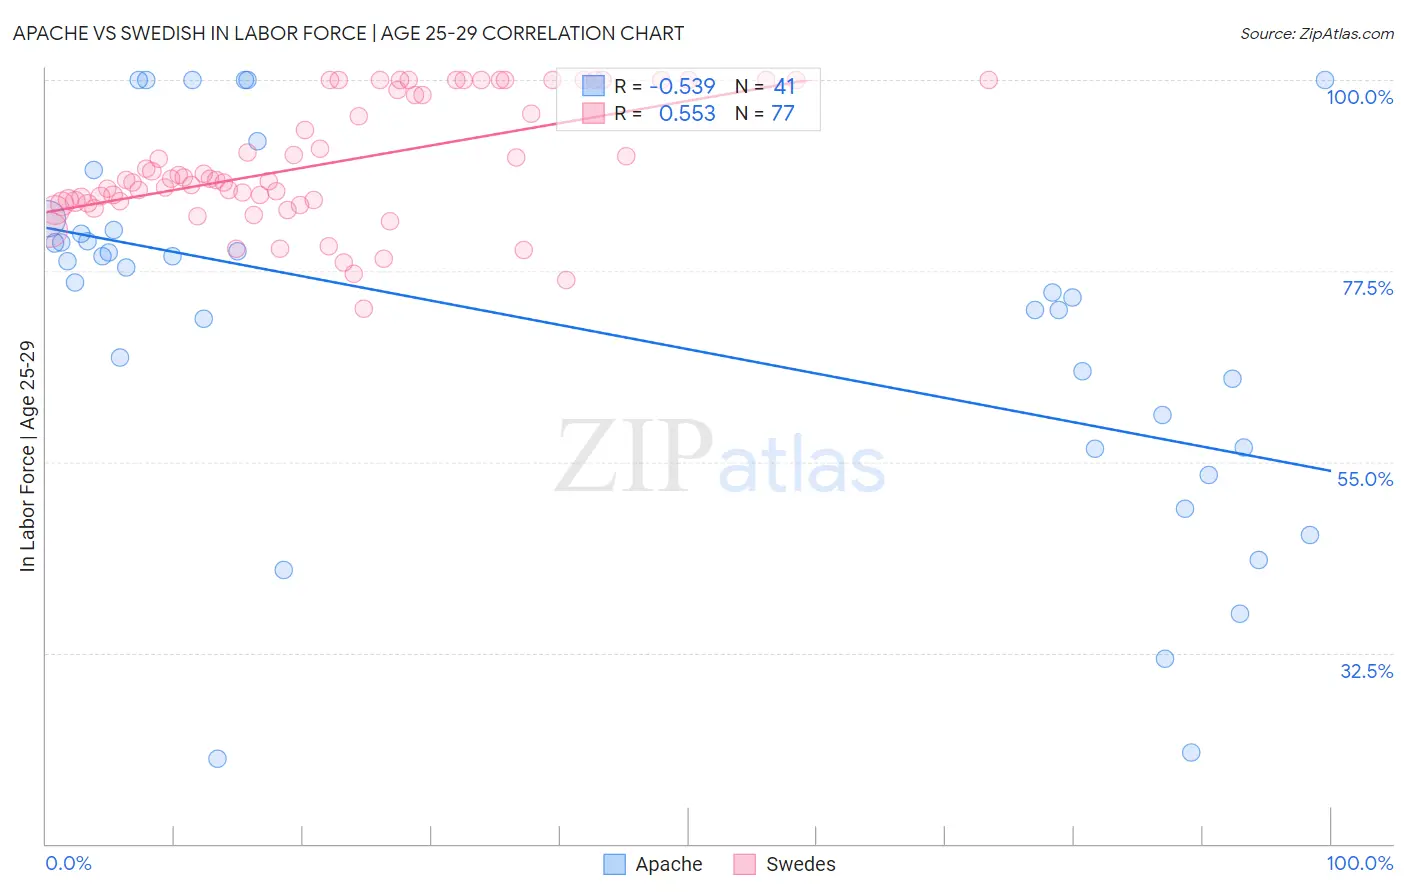
Apache vs Swedish In Labor Force | Age 25-29 Correlation Chart
The statistical analysis conducted on geographies consisting of 231,063,738 people shows a substantial negative correlation between the proportion of Apache and labor force participation rate among population between the ages 25 and 29 in the United States with a correlation coefficient (R) of -0.539 and weighted average of 79.2%. Similarly, the statistical analysis conducted on geographies consisting of 538,345,964 people shows a substantial positive correlation between the proportion of Swedes and labor force participation rate among population between the ages 25 and 29 in the United States with a correlation coefficient (R) of 0.553 and weighted average of 85.6%, a difference of 8.1%.
In Labor Force | Age 25-29 Correlation Summary
| Measurement | Apache | Swedish |
| Minimum | 20.0% | 73.1% |
| Maximum | 100.0% | 100.0% |
| Range | 80.0% | 26.9% |
| Mean | 70.9% | 90.1% |
| Median | 76.2% | 88.2% |
| Interquartile 25% (IQ1) | 56.6% | 85.6% |
| Interquartile 75% (IQ3) | 82.1% | 99.4% |
| Interquartile Range (IQR) | 25.5% | 13.8% |
| Standard Deviation (Sample) | 21.4% | 7.3% |
| Standard Deviation (Population) | 21.2% | 7.2% |
Similar Demographics by In Labor Force | Age 25-29
Demographics Similar to Apache by In Labor Force | Age 25-29
In terms of in labor force | age 25-29, the demographic groups most similar to Apache are Native/Alaskan (79.3%, a difference of 0.070%), Yuman (79.3%, a difference of 0.16%), Sioux (79.7%, a difference of 0.57%), Inupiat (79.8%, a difference of 0.68%), and Crow (78.6%, a difference of 0.76%).
| Demographics | Rating | Rank | In Labor Force | Age 25-29 |
| Yakama | 0.0 /100 | #329 | Tragic 80.6% |
| Puerto Ricans | 0.0 /100 | #330 | Tragic 80.4% |
| Cheyenne | 0.0 /100 | #331 | Tragic 80.3% |
| Inupiat | 0.0 /100 | #332 | Tragic 79.8% |
| Sioux | 0.0 /100 | #333 | Tragic 79.7% |
| Yuman | 0.0 /100 | #334 | Tragic 79.3% |
| Natives/Alaskans | 0.0 /100 | #335 | Tragic 79.3% |
| Apache | 0.0 /100 | #336 | Tragic 79.2% |
| Crow | 0.0 /100 | #337 | Tragic 78.6% |
| Lumbee | 0.0 /100 | #338 | Tragic 78.3% |
| Immigrants | Yemen | 0.0 /100 | #339 | Tragic 78.2% |
| Paiute | 0.0 /100 | #340 | Tragic 78.1% |
| Tohono O'odham | 0.0 /100 | #341 | Tragic 77.5% |
| Pueblo | 0.0 /100 | #342 | Tragic 77.5% |
| Arapaho | 0.0 /100 | #343 | Tragic 76.6% |
Demographics Similar to Swedes by In Labor Force | Age 25-29
In terms of in labor force | age 25-29, the demographic groups most similar to Swedes are Italian (85.6%, a difference of 0.010%), Turkish (85.6%, a difference of 0.020%), Yugoslavian (85.6%, a difference of 0.030%), Immigrants from Latvia (85.6%, a difference of 0.030%), and Czech (85.6%, a difference of 0.040%).
| Demographics | Rating | Rank | In Labor Force | Age 25-29 |
| Immigrants | Eritrea | 99.9 /100 | #42 | Exceptional 85.7% |
| Immigrants | India | 99.9 /100 | #43 | Exceptional 85.7% |
| Macedonians | 99.9 /100 | #44 | Exceptional 85.7% |
| Immigrants | Sierra Leone | 99.9 /100 | #45 | Exceptional 85.7% |
| Czechs | 99.8 /100 | #46 | Exceptional 85.6% |
| Turks | 99.8 /100 | #47 | Exceptional 85.6% |
| Italians | 99.8 /100 | #48 | Exceptional 85.6% |
| Swedes | 99.8 /100 | #49 | Exceptional 85.6% |
| Yugoslavians | 99.8 /100 | #50 | Exceptional 85.6% |
| Immigrants | Latvia | 99.8 /100 | #51 | Exceptional 85.6% |
| Immigrants | Poland | 99.7 /100 | #52 | Exceptional 85.6% |
| Belgians | 99.7 /100 | #53 | Exceptional 85.5% |
| Albanians | 99.7 /100 | #54 | Exceptional 85.5% |
| Immigrants | Brazil | 99.7 /100 | #55 | Exceptional 85.5% |
| Eastern Europeans | 99.6 /100 | #56 | Exceptional 85.5% |