Apache vs South American In Labor Force | Age 25-29
COMPARE
Apache
South American
In Labor Force | Age 25-29
In Labor Force | Age 25-29 Comparison
Apache
South Americans
79.2%
IN LABOR FORCE | AGE 25-29
0.0/ 100
METRIC RATING
336th/ 347
METRIC RANK
84.7%
IN LABOR FORCE | AGE 25-29
54.9/ 100
METRIC RATING
168th/ 347
METRIC RANK
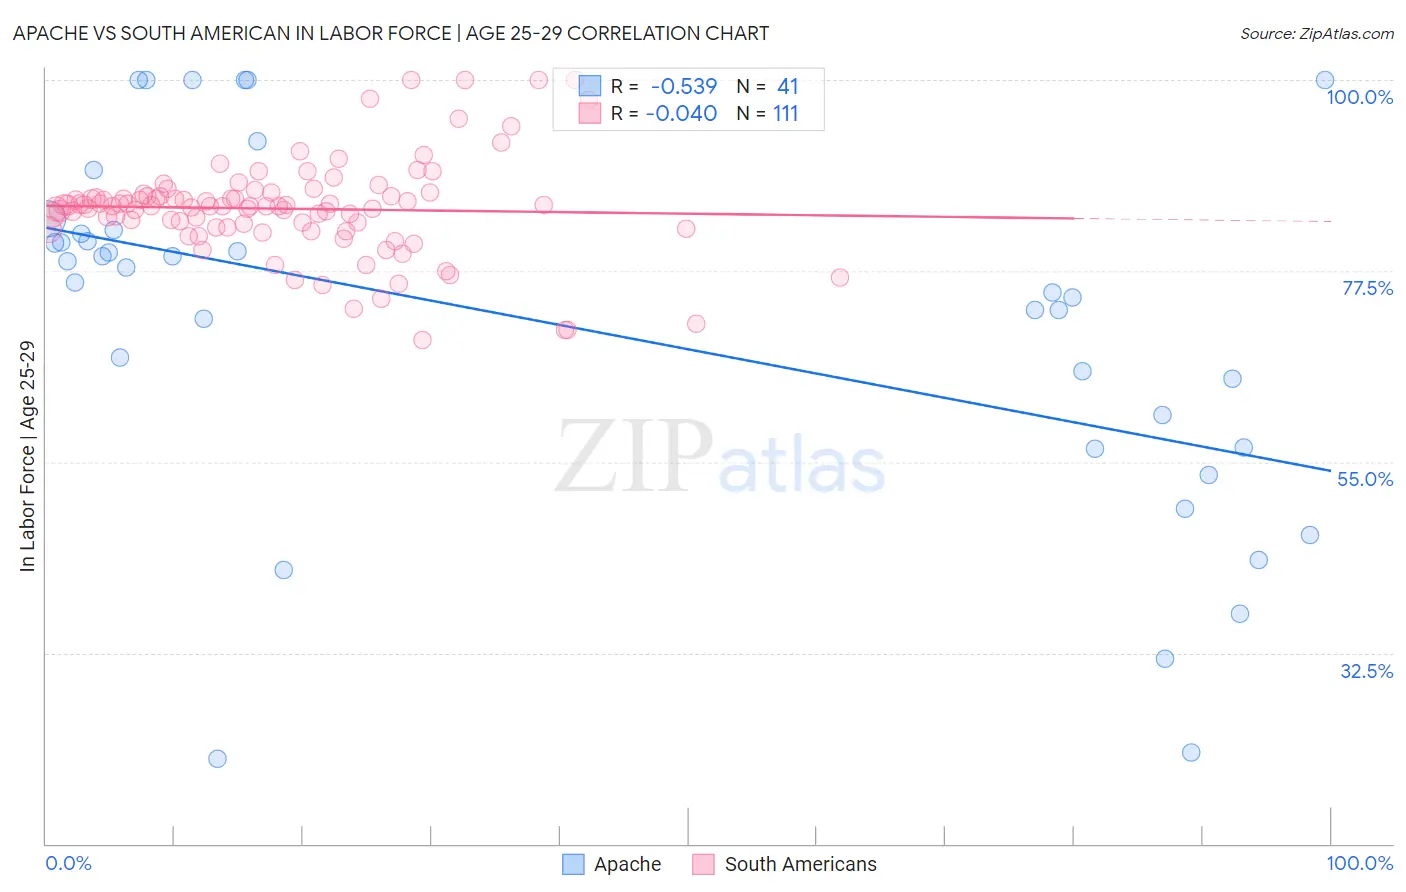
Apache vs South American In Labor Force | Age 25-29 Correlation Chart
The statistical analysis conducted on geographies consisting of 231,063,738 people shows a substantial negative correlation between the proportion of Apache and labor force participation rate among population between the ages 25 and 29 in the United States with a correlation coefficient (R) of -0.539 and weighted average of 79.2%. Similarly, the statistical analysis conducted on geographies consisting of 493,840,082 people shows no correlation between the proportion of South Americans and labor force participation rate among population between the ages 25 and 29 in the United States with a correlation coefficient (R) of -0.040 and weighted average of 84.7%, a difference of 6.9%.
In Labor Force | Age 25-29 Correlation Summary
| Measurement | Apache | South American |
| Minimum | 20.0% | 69.3% |
| Maximum | 100.0% | 100.0% |
| Range | 80.0% | 30.7% |
| Mean | 70.9% | 84.8% |
| Median | 76.2% | 85.2% |
| Interquartile 25% (IQ1) | 56.6% | 82.6% |
| Interquartile 75% (IQ3) | 82.1% | 86.4% |
| Interquartile Range (IQR) | 25.5% | 3.7% |
| Standard Deviation (Sample) | 21.4% | 5.7% |
| Standard Deviation (Population) | 21.2% | 5.7% |
Similar Demographics by In Labor Force | Age 25-29
Demographics Similar to Apache by In Labor Force | Age 25-29
In terms of in labor force | age 25-29, the demographic groups most similar to Apache are Native/Alaskan (79.3%, a difference of 0.070%), Yuman (79.3%, a difference of 0.16%), Sioux (79.7%, a difference of 0.57%), Inupiat (79.8%, a difference of 0.68%), and Crow (78.6%, a difference of 0.76%).
| Demographics | Rating | Rank | In Labor Force | Age 25-29 |
| Yakama | 0.0 /100 | #329 | Tragic 80.6% |
| Puerto Ricans | 0.0 /100 | #330 | Tragic 80.4% |
| Cheyenne | 0.0 /100 | #331 | Tragic 80.3% |
| Inupiat | 0.0 /100 | #332 | Tragic 79.8% |
| Sioux | 0.0 /100 | #333 | Tragic 79.7% |
| Yuman | 0.0 /100 | #334 | Tragic 79.3% |
| Natives/Alaskans | 0.0 /100 | #335 | Tragic 79.3% |
| Apache | 0.0 /100 | #336 | Tragic 79.2% |
| Crow | 0.0 /100 | #337 | Tragic 78.6% |
| Lumbee | 0.0 /100 | #338 | Tragic 78.3% |
| Immigrants | Yemen | 0.0 /100 | #339 | Tragic 78.2% |
| Paiute | 0.0 /100 | #340 | Tragic 78.1% |
| Tohono O'odham | 0.0 /100 | #341 | Tragic 77.5% |
| Pueblo | 0.0 /100 | #342 | Tragic 77.5% |
| Arapaho | 0.0 /100 | #343 | Tragic 76.6% |
Demographics Similar to South Americans by In Labor Force | Age 25-29
In terms of in labor force | age 25-29, the demographic groups most similar to South Americans are Immigrants from Spain (84.7%, a difference of 0.010%), Indonesian (84.7%, a difference of 0.010%), Argentinean (84.7%, a difference of 0.020%), Ghanaian (84.7%, a difference of 0.020%), and Immigrants from Burma/Myanmar (84.7%, a difference of 0.020%).
| Demographics | Rating | Rank | In Labor Force | Age 25-29 |
| Canadians | 58.5 /100 | #161 | Average 84.7% |
| Immigrants | Colombia | 58.3 /100 | #162 | Average 84.7% |
| Argentineans | 57.9 /100 | #163 | Average 84.7% |
| Ghanaians | 57.6 /100 | #164 | Average 84.7% |
| Immigrants | Burma/Myanmar | 57.4 /100 | #165 | Average 84.7% |
| Immigrants | Spain | 56.9 /100 | #166 | Average 84.7% |
| Indonesians | 56.5 /100 | #167 | Average 84.7% |
| South Americans | 54.9 /100 | #168 | Average 84.7% |
| Celtics | 52.5 /100 | #169 | Average 84.7% |
| Tongans | 52.4 /100 | #170 | Average 84.7% |
| Immigrants | Vietnam | 50.5 /100 | #171 | Average 84.7% |
| Immigrants | Western Europe | 50.4 /100 | #172 | Average 84.7% |
| Assyrians/Chaldeans/Syriacs | 50.2 /100 | #173 | Average 84.7% |
| Palestinians | 50.0 /100 | #174 | Average 84.7% |
| Hungarians | 47.8 /100 | #175 | Average 84.6% |