Immigrants from Cambodia vs Ottawa In Labor Force | Age 45-54
COMPARE
Immigrants from Cambodia
Ottawa
In Labor Force | Age 45-54
In Labor Force | Age 45-54 Comparison
Immigrants from Cambodia
Ottawa
81.9%
IN LABOR FORCE | AGE 45-54
0.8/ 100
METRIC RATING
241st/ 347
METRIC RANK
79.5%
IN LABOR FORCE | AGE 45-54
0.0/ 100
METRIC RATING
314th/ 347
METRIC RANK
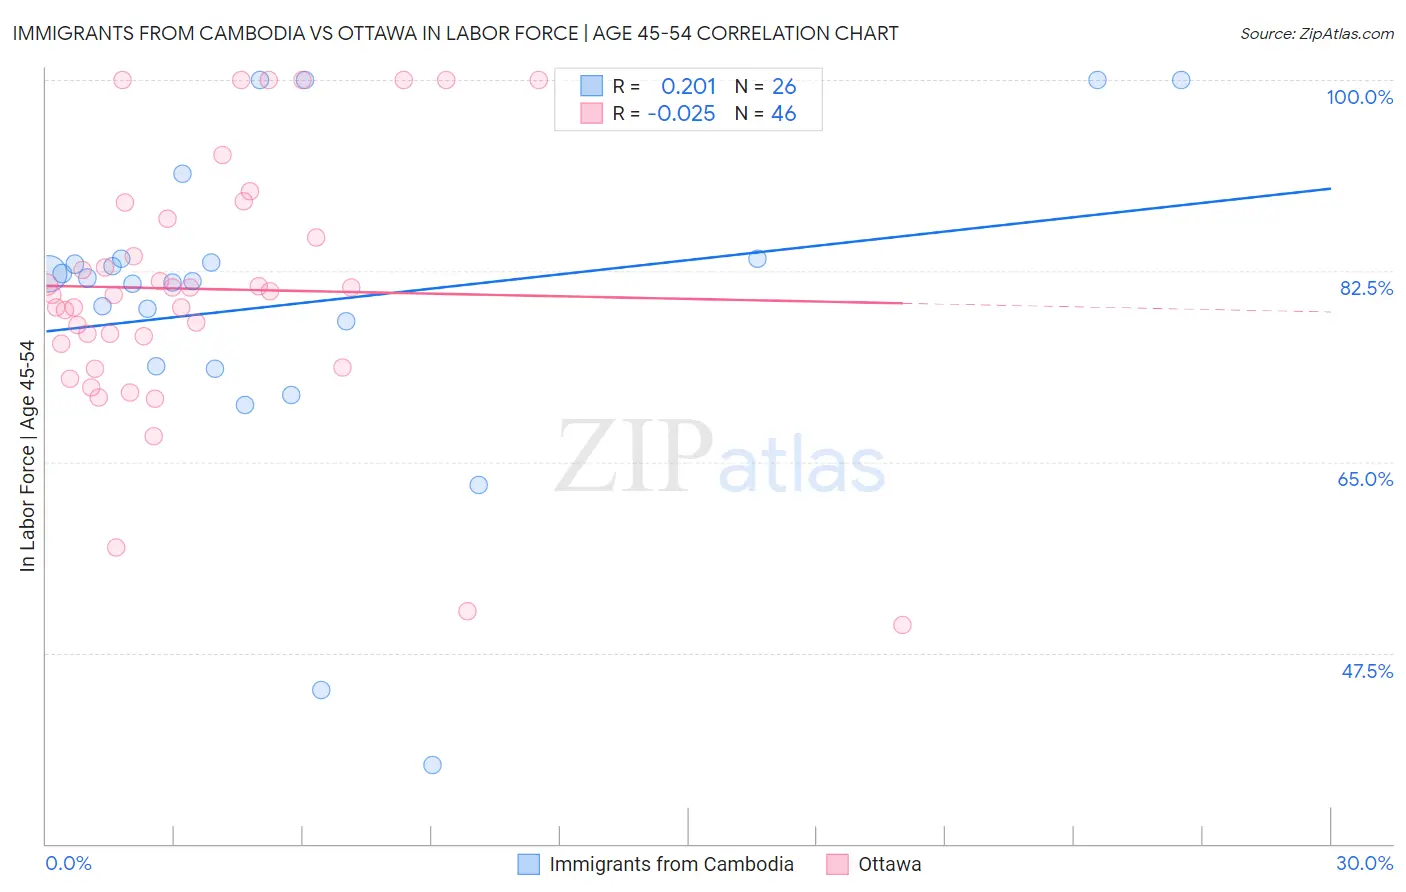
Immigrants from Cambodia vs Ottawa In Labor Force | Age 45-54 Correlation Chart
The statistical analysis conducted on geographies consisting of 205,128,905 people shows a weak positive correlation between the proportion of Immigrants from Cambodia and labor force participation rate among population between the ages 45 and 54 in the United States with a correlation coefficient (R) of 0.201 and weighted average of 81.9%. Similarly, the statistical analysis conducted on geographies consisting of 49,943,956 people shows no correlation between the proportion of Ottawa and labor force participation rate among population between the ages 45 and 54 in the United States with a correlation coefficient (R) of -0.025 and weighted average of 79.5%, a difference of 3.0%.
In Labor Force | Age 45-54 Correlation Summary
| Measurement | Immigrants from Cambodia | Ottawa |
| Minimum | 37.2% | 50.0% |
| Maximum | 100.0% | 100.0% |
| Range | 62.8% | 50.0% |
| Mean | 79.5% | 80.8% |
| Median | 81.7% | 80.5% |
| Interquartile 25% (IQ1) | 73.8% | 75.9% |
| Interquartile 75% (IQ3) | 83.6% | 87.2% |
| Interquartile Range (IQR) | 9.8% | 11.4% |
| Standard Deviation (Sample) | 14.8% | 11.8% |
| Standard Deviation (Population) | 14.5% | 11.6% |
Similar Demographics by In Labor Force | Age 45-54
Demographics Similar to Immigrants from Cambodia by In Labor Force | Age 45-54
In terms of in labor force | age 45-54, the demographic groups most similar to Immigrants from Cambodia are White/Caucasian (81.9%, a difference of 0.040%), Immigrants from El Salvador (81.9%, a difference of 0.050%), Samoan (81.8%, a difference of 0.050%), Immigrants from Thailand (81.9%, a difference of 0.060%), and Trinidadian and Tobagonian (81.9%, a difference of 0.080%).
| Demographics | Rating | Rank | In Labor Force | Age 45-54 |
| Salvadorans | 1.7 /100 | #234 | Tragic 82.0% |
| Sub-Saharan Africans | 1.2 /100 | #235 | Tragic 82.0% |
| Basques | 1.2 /100 | #236 | Tragic 82.0% |
| Immigrants | Trinidad and Tobago | 1.2 /100 | #237 | Tragic 82.0% |
| Trinidadians and Tobagonians | 1.1 /100 | #238 | Tragic 81.9% |
| Immigrants | Thailand | 1.0 /100 | #239 | Tragic 81.9% |
| Immigrants | El Salvador | 1.0 /100 | #240 | Tragic 81.9% |
| Immigrants | Cambodia | 0.8 /100 | #241 | Tragic 81.9% |
| Whites/Caucasians | 0.7 /100 | #242 | Tragic 81.9% |
| Samoans | 0.6 /100 | #243 | Tragic 81.8% |
| Celtics | 0.4 /100 | #244 | Tragic 81.8% |
| Alaska Natives | 0.4 /100 | #245 | Tragic 81.8% |
| Alaskan Athabascans | 0.4 /100 | #246 | Tragic 81.8% |
| Central Americans | 0.4 /100 | #247 | Tragic 81.7% |
| Puget Sound Salish | 0.3 /100 | #248 | Tragic 81.7% |
Demographics Similar to Ottawa by In Labor Force | Age 45-54
In terms of in labor force | age 45-54, the demographic groups most similar to Ottawa are Colville (79.5%, a difference of 0.040%), Black/African American (79.3%, a difference of 0.14%), Shoshone (79.3%, a difference of 0.22%), Immigrants from Mexico (79.7%, a difference of 0.28%), and Comanche (79.2%, a difference of 0.35%).
| Demographics | Rating | Rank | In Labor Force | Age 45-54 |
| Blackfeet | 0.0 /100 | #307 | Tragic 80.0% |
| Central American Indians | 0.0 /100 | #308 | Tragic 80.0% |
| Potawatomi | 0.0 /100 | #309 | Tragic 80.0% |
| Inupiat | 0.0 /100 | #310 | Tragic 79.9% |
| Mexicans | 0.0 /100 | #311 | Tragic 79.8% |
| Immigrants | Mexico | 0.0 /100 | #312 | Tragic 79.7% |
| Colville | 0.0 /100 | #313 | Tragic 79.5% |
| Ottawa | 0.0 /100 | #314 | Tragic 79.5% |
| Blacks/African Americans | 0.0 /100 | #315 | Tragic 79.3% |
| Shoshone | 0.0 /100 | #316 | Tragic 79.3% |
| Comanche | 0.0 /100 | #317 | Tragic 79.2% |
| Chickasaw | 0.0 /100 | #318 | Tragic 79.0% |
| Cherokee | 0.0 /100 | #319 | Tragic 79.0% |
| Yaqui | 0.0 /100 | #320 | Tragic 78.9% |
| Yup'ik | 0.0 /100 | #321 | Tragic 78.6% |