Albanian vs Ottawa In Labor Force | Age 45-54
COMPARE
Albanian
Ottawa
In Labor Force | Age 45-54
In Labor Force | Age 45-54 Comparison
Albanians
Ottawa
83.3%
IN LABOR FORCE | AGE 45-54
93.9/ 100
METRIC RATING
103rd/ 347
METRIC RANK
79.5%
IN LABOR FORCE | AGE 45-54
0.0/ 100
METRIC RATING
314th/ 347
METRIC RANK
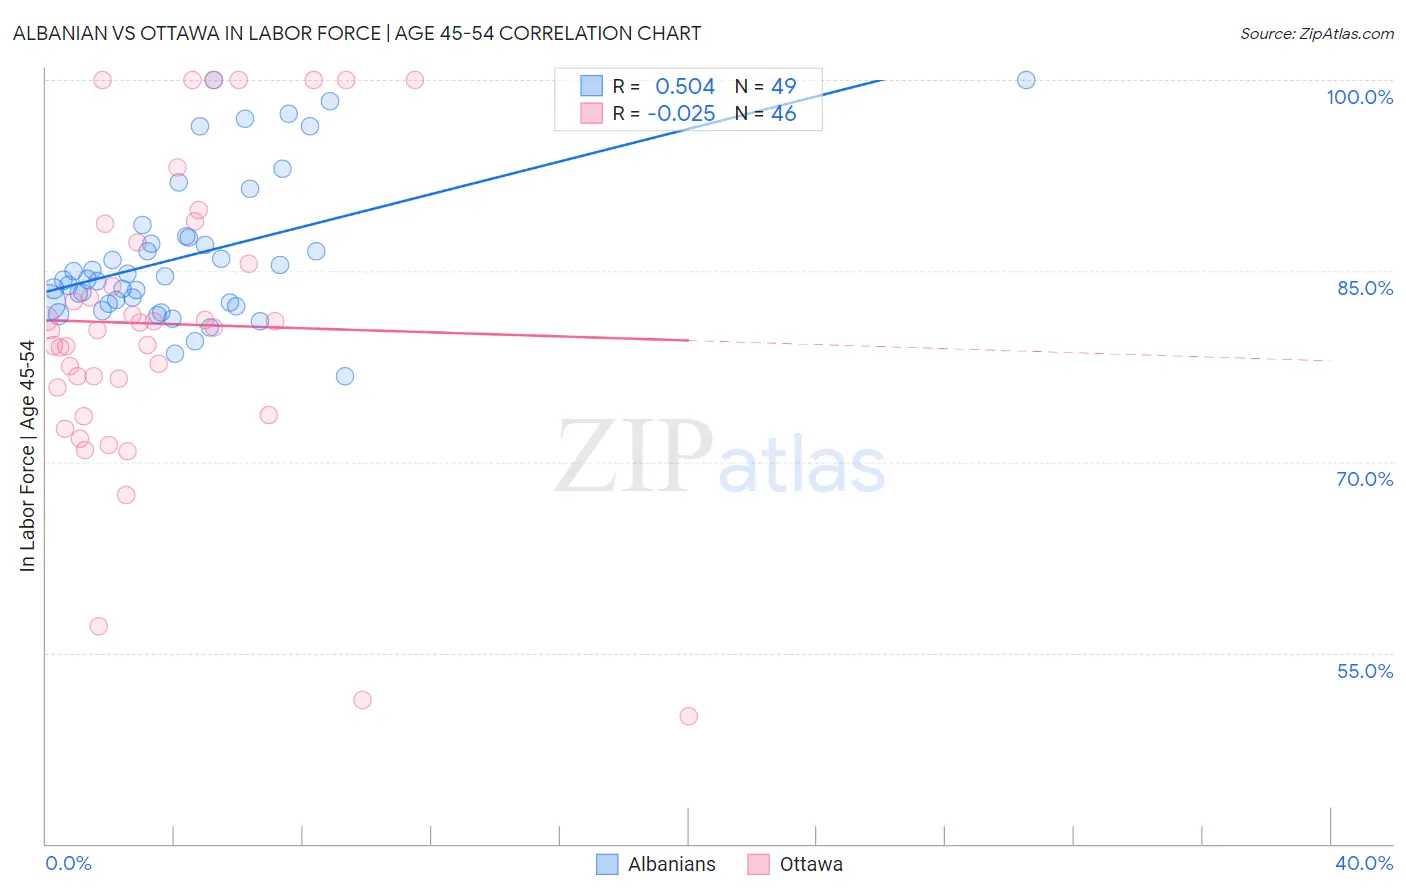
Albanian vs Ottawa In Labor Force | Age 45-54 Correlation Chart
The statistical analysis conducted on geographies consisting of 193,191,598 people shows a substantial positive correlation between the proportion of Albanians and labor force participation rate among population between the ages 45 and 54 in the United States with a correlation coefficient (R) of 0.504 and weighted average of 83.3%. Similarly, the statistical analysis conducted on geographies consisting of 49,943,956 people shows no correlation between the proportion of Ottawa and labor force participation rate among population between the ages 45 and 54 in the United States with a correlation coefficient (R) of -0.025 and weighted average of 79.5%, a difference of 4.8%.
In Labor Force | Age 45-54 Correlation Summary
| Measurement | Albanian | Ottawa |
| Minimum | 76.7% | 50.0% |
| Maximum | 100.0% | 100.0% |
| Range | 23.3% | 50.0% |
| Mean | 86.2% | 80.8% |
| Median | 84.3% | 80.5% |
| Interquartile 25% (IQ1) | 82.5% | 75.9% |
| Interquartile 75% (IQ3) | 87.7% | 87.2% |
| Interquartile Range (IQR) | 5.2% | 11.4% |
| Standard Deviation (Sample) | 5.8% | 11.8% |
| Standard Deviation (Population) | 5.7% | 11.6% |
Similar Demographics by In Labor Force | Age 45-54
Demographics Similar to Albanians by In Labor Force | Age 45-54
In terms of in labor force | age 45-54, the demographic groups most similar to Albanians are Immigrants from Singapore (83.3%, a difference of 0.0%), Immigrants from Romania (83.3%, a difference of 0.0%), Immigrants from Middle Africa (83.3%, a difference of 0.010%), Mongolian (83.3%, a difference of 0.010%), and Immigrants from Belarus (83.3%, a difference of 0.010%).
| Demographics | Rating | Rank | In Labor Force | Age 45-54 |
| Immigrants | Kuwait | 94.8 /100 | #96 | Exceptional 83.3% |
| Palestinians | 94.8 /100 | #97 | Exceptional 83.3% |
| Maltese | 94.4 /100 | #98 | Exceptional 83.3% |
| Immigrants | Middle Africa | 94.3 /100 | #99 | Exceptional 83.3% |
| Mongolians | 94.2 /100 | #100 | Exceptional 83.3% |
| Immigrants | Belarus | 94.1 /100 | #101 | Exceptional 83.3% |
| Immigrants | Singapore | 93.9 /100 | #102 | Exceptional 83.3% |
| Albanians | 93.9 /100 | #103 | Exceptional 83.3% |
| Immigrants | Romania | 93.8 /100 | #104 | Exceptional 83.3% |
| Immigrants | South America | 93.5 /100 | #105 | Exceptional 83.2% |
| Sri Lankans | 93.2 /100 | #106 | Exceptional 83.2% |
| Iranians | 92.9 /100 | #107 | Exceptional 83.2% |
| Slovaks | 92.8 /100 | #108 | Exceptional 83.2% |
| Ukrainians | 92.7 /100 | #109 | Exceptional 83.2% |
| Immigrants | Africa | 92.6 /100 | #110 | Exceptional 83.2% |
Demographics Similar to Ottawa by In Labor Force | Age 45-54
In terms of in labor force | age 45-54, the demographic groups most similar to Ottawa are Colville (79.5%, a difference of 0.040%), Black/African American (79.3%, a difference of 0.14%), Shoshone (79.3%, a difference of 0.22%), Immigrants from Mexico (79.7%, a difference of 0.28%), and Comanche (79.2%, a difference of 0.35%).
| Demographics | Rating | Rank | In Labor Force | Age 45-54 |
| Blackfeet | 0.0 /100 | #307 | Tragic 80.0% |
| Central American Indians | 0.0 /100 | #308 | Tragic 80.0% |
| Potawatomi | 0.0 /100 | #309 | Tragic 80.0% |
| Inupiat | 0.0 /100 | #310 | Tragic 79.9% |
| Mexicans | 0.0 /100 | #311 | Tragic 79.8% |
| Immigrants | Mexico | 0.0 /100 | #312 | Tragic 79.7% |
| Colville | 0.0 /100 | #313 | Tragic 79.5% |
| Ottawa | 0.0 /100 | #314 | Tragic 79.5% |
| Blacks/African Americans | 0.0 /100 | #315 | Tragic 79.3% |
| Shoshone | 0.0 /100 | #316 | Tragic 79.3% |
| Comanche | 0.0 /100 | #317 | Tragic 79.2% |
| Chickasaw | 0.0 /100 | #318 | Tragic 79.0% |
| Cherokee | 0.0 /100 | #319 | Tragic 79.0% |
| Yaqui | 0.0 /100 | #320 | Tragic 78.9% |
| Yup'ik | 0.0 /100 | #321 | Tragic 78.6% |