American vs Bahamian In Labor Force | Age 35-44
COMPARE
American
Bahamian
In Labor Force | Age 35-44
In Labor Force | Age 35-44 Comparison
Americans
Bahamians
82.4%
IN LABOR FORCE | AGE 35-44
0.0/ 100
METRIC RATING
302nd/ 347
METRIC RANK
84.7%
IN LABOR FORCE | AGE 35-44
93.2/ 100
METRIC RATING
115th/ 347
METRIC RANK
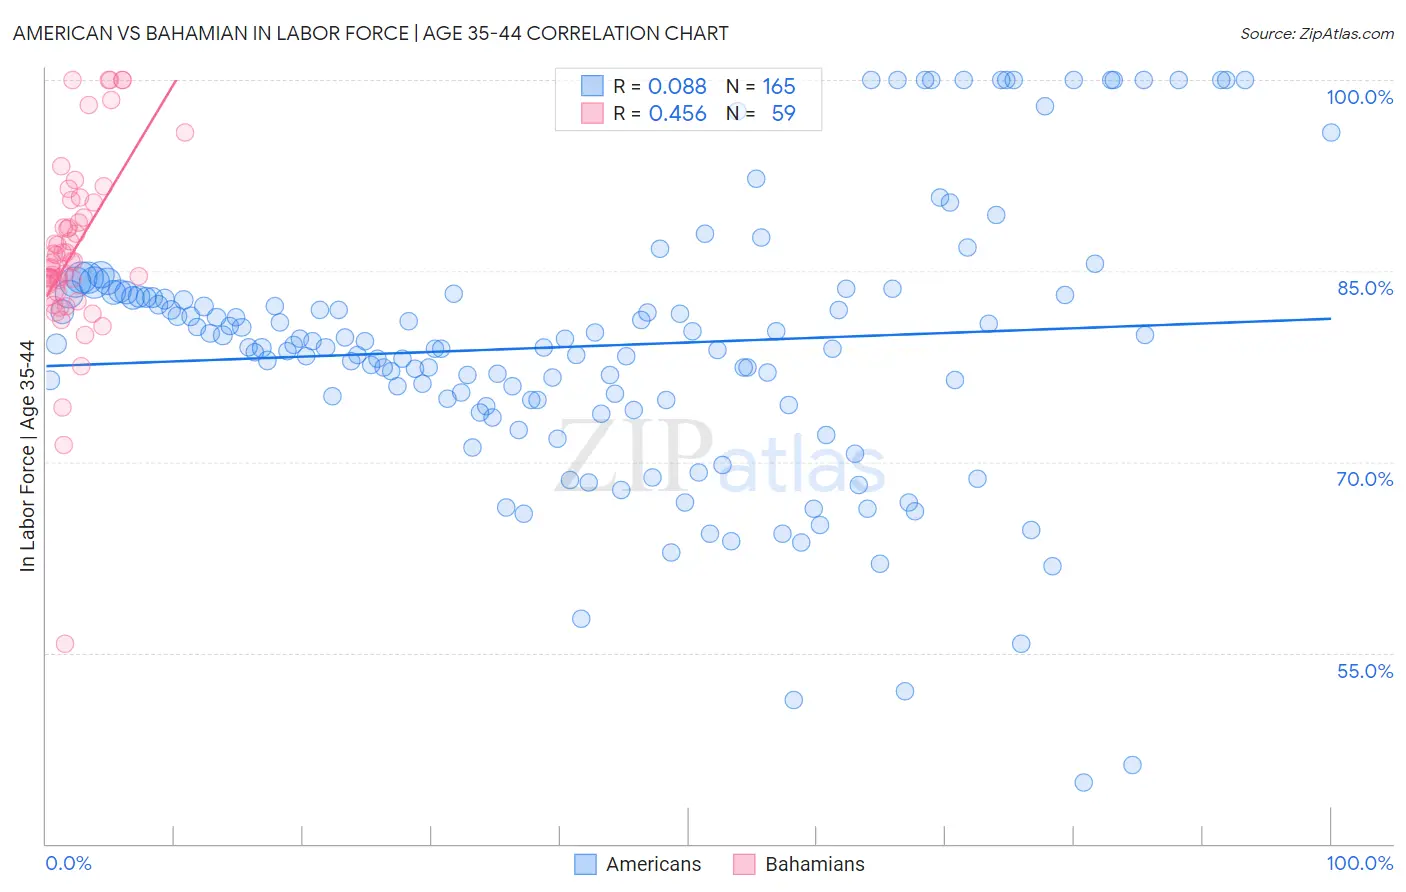
American vs Bahamian In Labor Force | Age 35-44 Correlation Chart
The statistical analysis conducted on geographies consisting of 581,120,532 people shows a slight positive correlation between the proportion of Americans and labor force participation rate among population between the ages 35 and 44 in the United States with a correlation coefficient (R) of 0.088 and weighted average of 82.4%. Similarly, the statistical analysis conducted on geographies consisting of 112,616,837 people shows a moderate positive correlation between the proportion of Bahamians and labor force participation rate among population between the ages 35 and 44 in the United States with a correlation coefficient (R) of 0.456 and weighted average of 84.7%, a difference of 2.8%.
In Labor Force | Age 35-44 Correlation Summary
| Measurement | American | Bahamian |
| Minimum | 44.8% | 55.7% |
| Maximum | 100.0% | 100.0% |
| Range | 55.2% | 44.3% |
| Mean | 79.1% | 86.6% |
| Median | 79.0% | 85.7% |
| Interquartile 25% (IQ1) | 74.7% | 83.7% |
| Interquartile 75% (IQ3) | 83.2% | 90.4% |
| Interquartile Range (IQR) | 8.5% | 6.7% |
| Standard Deviation (Sample) | 10.7% | 7.4% |
| Standard Deviation (Population) | 10.7% | 7.3% |
Similar Demographics by In Labor Force | Age 35-44
Demographics Similar to Americans by In Labor Force | Age 35-44
In terms of in labor force | age 35-44, the demographic groups most similar to Americans are Nepalese (82.4%, a difference of 0.0%), Marshallese (82.4%, a difference of 0.010%), Spanish American Indian (82.5%, a difference of 0.080%), Central American Indian (82.5%, a difference of 0.10%), and Tlingit-Haida (82.5%, a difference of 0.16%).
| Demographics | Rating | Rank | In Labor Force | Age 35-44 |
| Immigrants | Lebanon | 0.0 /100 | #295 | Tragic 82.7% |
| Mexican American Indians | 0.0 /100 | #296 | Tragic 82.6% |
| Hmong | 0.0 /100 | #297 | Tragic 82.6% |
| Ottawa | 0.0 /100 | #298 | Tragic 82.6% |
| Tlingit-Haida | 0.0 /100 | #299 | Tragic 82.5% |
| Central American Indians | 0.0 /100 | #300 | Tragic 82.5% |
| Spanish American Indians | 0.0 /100 | #301 | Tragic 82.5% |
| Americans | 0.0 /100 | #302 | Tragic 82.4% |
| Nepalese | 0.0 /100 | #303 | Tragic 82.4% |
| Marshallese | 0.0 /100 | #304 | Tragic 82.4% |
| Shoshone | 0.0 /100 | #305 | Tragic 82.2% |
| Blacks/African Americans | 0.0 /100 | #306 | Tragic 82.2% |
| Hispanics or Latinos | 0.0 /100 | #307 | Tragic 82.1% |
| Immigrants | Central America | 0.0 /100 | #308 | Tragic 82.0% |
| Cree | 0.0 /100 | #309 | Tragic 82.0% |
Demographics Similar to Bahamians by In Labor Force | Age 35-44
In terms of in labor force | age 35-44, the demographic groups most similar to Bahamians are Immigrants from Western Africa (84.7%, a difference of 0.0%), Uruguayan (84.7%, a difference of 0.0%), Chilean (84.7%, a difference of 0.0%), Ukrainian (84.7%, a difference of 0.010%), and Immigrants from Egypt (84.7%, a difference of 0.010%).
| Demographics | Rating | Rank | In Labor Force | Age 35-44 |
| Immigrants | Argentina | 94.5 /100 | #108 | Exceptional 84.8% |
| Immigrants | Russia | 94.5 /100 | #109 | Exceptional 84.8% |
| Filipinos | 93.8 /100 | #110 | Exceptional 84.7% |
| Ukrainians | 93.5 /100 | #111 | Exceptional 84.7% |
| Immigrants | Western Africa | 93.4 /100 | #112 | Exceptional 84.7% |
| Uruguayans | 93.3 /100 | #113 | Exceptional 84.7% |
| Chileans | 93.2 /100 | #114 | Exceptional 84.7% |
| Bahamians | 93.2 /100 | #115 | Exceptional 84.7% |
| Immigrants | Egypt | 92.7 /100 | #116 | Exceptional 84.7% |
| Immigrants | China | 92.3 /100 | #117 | Exceptional 84.7% |
| Immigrants | Eastern Asia | 92.1 /100 | #118 | Exceptional 84.7% |
| Burmese | 91.8 /100 | #119 | Exceptional 84.7% |
| Immigrants | Northern Europe | 91.5 /100 | #120 | Exceptional 84.7% |
| Finns | 91.2 /100 | #121 | Exceptional 84.7% |
| Germans | 91.0 /100 | #122 | Exceptional 84.7% |