American vs Argentinean Associate's Degree
COMPARE
American
Argentinean
Associate's Degree
Associate's Degree Comparison
Americans
Argentineans
40.8%
ASSOCIATE'S DEGREE
0.2/ 100
METRIC RATING
269th/ 347
METRIC RANK
51.2%
ASSOCIATE'S DEGREE
99.6/ 100
METRIC RATING
67th/ 347
METRIC RANK
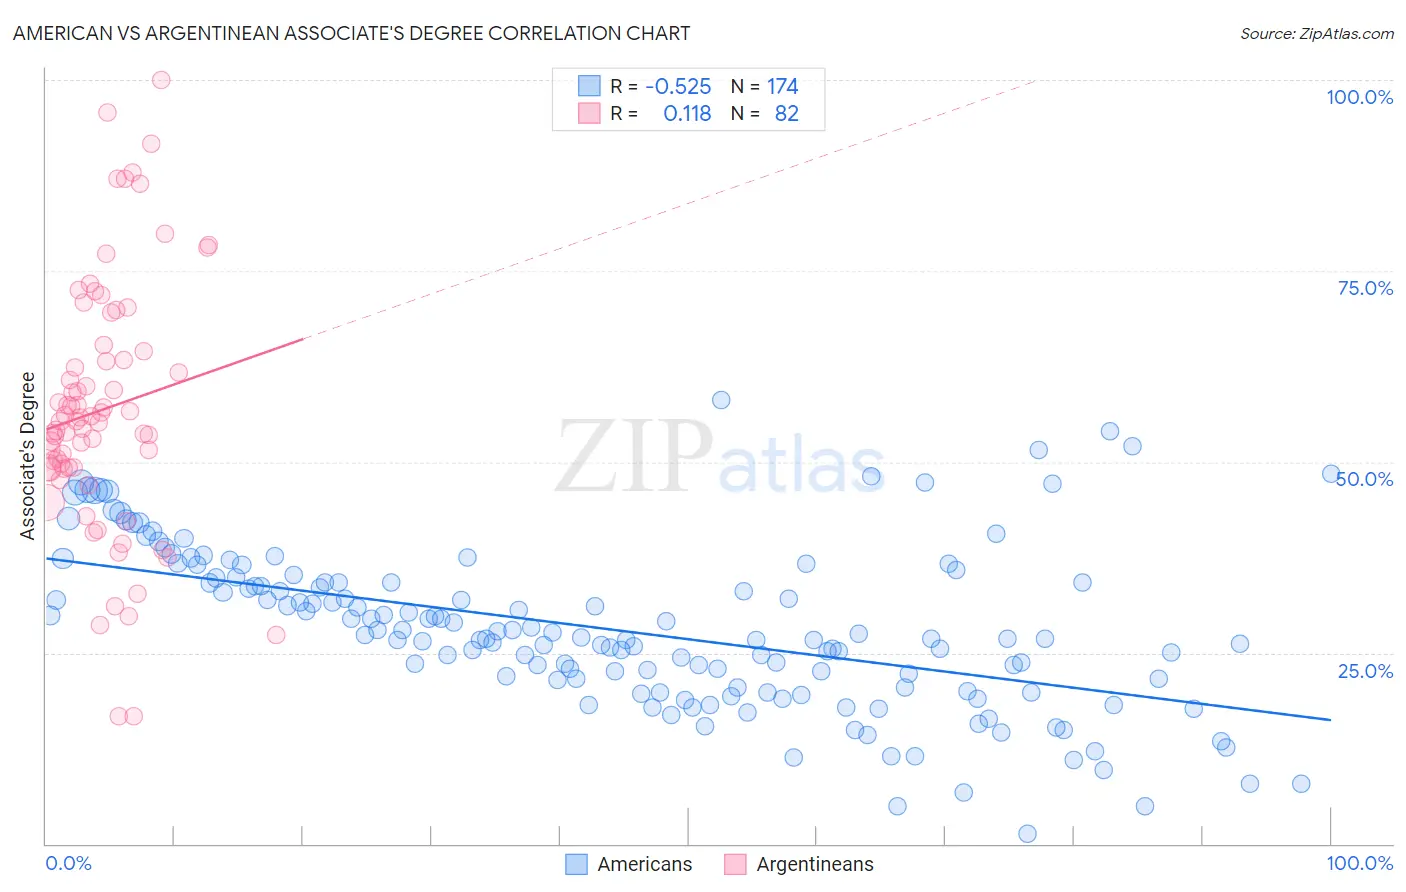
American vs Argentinean Associate's Degree Correlation Chart
The statistical analysis conducted on geographies consisting of 581,858,249 people shows a substantial negative correlation between the proportion of Americans and percentage of population with at least associate's degree education in the United States with a correlation coefficient (R) of -0.525 and weighted average of 40.8%. Similarly, the statistical analysis conducted on geographies consisting of 297,131,671 people shows a poor positive correlation between the proportion of Argentineans and percentage of population with at least associate's degree education in the United States with a correlation coefficient (R) of 0.118 and weighted average of 51.2%, a difference of 25.7%.
Associate's Degree Correlation Summary
| Measurement | American | Argentinean |
| Minimum | 1.4% | 16.7% |
| Maximum | 58.1% | 100.0% |
| Range | 56.7% | 83.3% |
| Mean | 28.0% | 56.8% |
| Median | 26.9% | 55.3% |
| Interquartile 25% (IQ1) | 20.4% | 49.2% |
| Interquartile 75% (IQ3) | 34.2% | 64.5% |
| Interquartile Range (IQR) | 13.8% | 15.4% |
| Standard Deviation (Sample) | 10.6% | 16.6% |
| Standard Deviation (Population) | 10.5% | 16.5% |
Similar Demographics by Associate's Degree
Demographics Similar to Americans by Associate's Degree
In terms of associate's degree, the demographic groups most similar to Americans are Chippewa (40.7%, a difference of 0.050%), Central American Indian (40.8%, a difference of 0.18%), Immigrants from Laos (40.7%, a difference of 0.23%), Belizean (40.6%, a difference of 0.30%), and Hawaiian (40.9%, a difference of 0.38%).
| Demographics | Rating | Rank | Associate's Degree |
| Bahamians | 0.4 /100 | #262 | Tragic 41.5% |
| Immigrants | Jamaica | 0.3 /100 | #263 | Tragic 41.5% |
| Osage | 0.3 /100 | #264 | Tragic 41.5% |
| Africans | 0.2 /100 | #265 | Tragic 41.1% |
| Samoans | 0.2 /100 | #266 | Tragic 41.1% |
| Hawaiians | 0.2 /100 | #267 | Tragic 40.9% |
| Central American Indians | 0.2 /100 | #268 | Tragic 40.8% |
| Americans | 0.2 /100 | #269 | Tragic 40.8% |
| Chippewa | 0.2 /100 | #270 | Tragic 40.7% |
| Immigrants | Laos | 0.1 /100 | #271 | Tragic 40.7% |
| Belizeans | 0.1 /100 | #272 | Tragic 40.6% |
| Puget Sound Salish | 0.1 /100 | #273 | Tragic 40.5% |
| Immigrants | Dominica | 0.1 /100 | #274 | Tragic 40.5% |
| Potawatomi | 0.1 /100 | #275 | Tragic 40.4% |
| Puerto Ricans | 0.1 /100 | #276 | Tragic 40.4% |
Demographics Similar to Argentineans by Associate's Degree
In terms of associate's degree, the demographic groups most similar to Argentineans are Immigrants from Europe (51.3%, a difference of 0.13%), Zimbabwean (51.3%, a difference of 0.18%), Immigrants from Netherlands (51.4%, a difference of 0.22%), South African (51.4%, a difference of 0.29%), and Bhutanese (51.4%, a difference of 0.34%).
| Demographics | Rating | Rank | Associate's Degree |
| Immigrants | Bolivia | 99.7 /100 | #60 | Exceptional 51.5% |
| Immigrants | Kazakhstan | 99.7 /100 | #61 | Exceptional 51.4% |
| Bhutanese | 99.7 /100 | #62 | Exceptional 51.4% |
| South Africans | 99.7 /100 | #63 | Exceptional 51.4% |
| Immigrants | Netherlands | 99.7 /100 | #64 | Exceptional 51.4% |
| Zimbabweans | 99.7 /100 | #65 | Exceptional 51.3% |
| Immigrants | Europe | 99.7 /100 | #66 | Exceptional 51.3% |
| Argentineans | 99.6 /100 | #67 | Exceptional 51.2% |
| Immigrants | Indonesia | 99.5 /100 | #68 | Exceptional 51.0% |
| Egyptians | 99.5 /100 | #69 | Exceptional 50.9% |
| Immigrants | Argentina | 99.5 /100 | #70 | Exceptional 50.9% |
| Immigrants | Romania | 99.5 /100 | #71 | Exceptional 50.9% |
| Immigrants | Pakistan | 99.5 /100 | #72 | Exceptional 50.9% |
| Carpatho Rusyns | 99.3 /100 | #73 | Exceptional 50.6% |
| Lithuanians | 99.3 /100 | #74 | Exceptional 50.6% |