Aleut vs Immigrants from Belize Unemployment Among Ages 65 to 74 years
COMPARE
Aleut
Immigrants from Belize
Unemployment Among Ages 65 to 74 years
Unemployment Among Ages 65 to 74 years Comparison
Aleuts
Immigrants from Belize
5.9%
UNEMPLOYMENT AMONG AGES 65 TO 74 YEARS
0.0/ 100
METRIC RATING
319th/ 347
METRIC RANK
5.5%
UNEMPLOYMENT AMONG AGES 65 TO 74 YEARS
2.2/ 100
METRIC RATING
237th/ 347
METRIC RANK
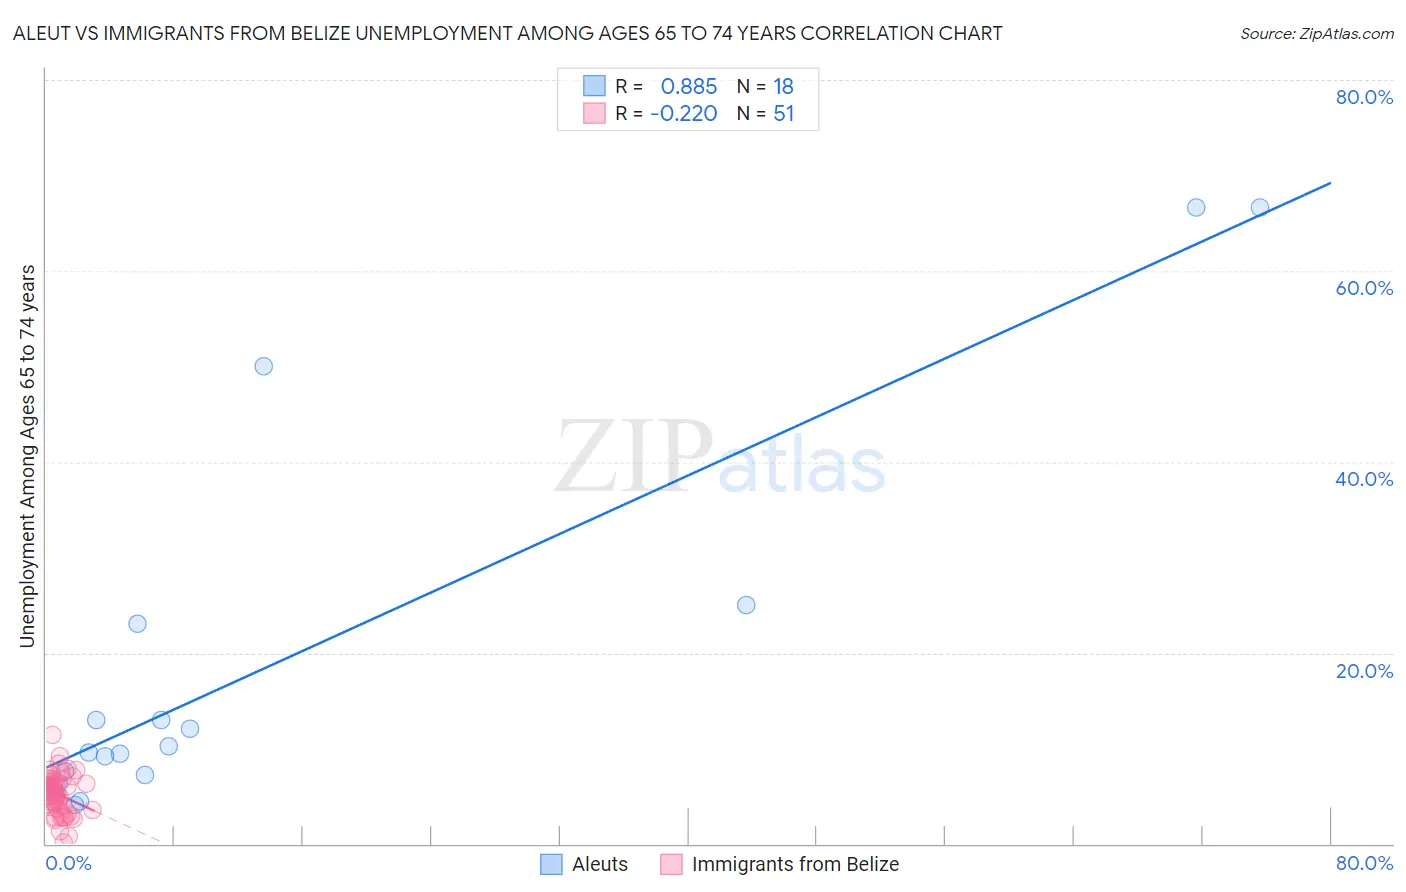
Aleut vs Immigrants from Belize Unemployment Among Ages 65 to 74 years Correlation Chart
The statistical analysis conducted on geographies consisting of 58,883,694 people shows a very strong positive correlation between the proportion of Aleuts and unemployment rate among population between the ages 65 and 74 in the United States with a correlation coefficient (R) of 0.885 and weighted average of 5.9%. Similarly, the statistical analysis conducted on geographies consisting of 124,538,788 people shows a weak negative correlation between the proportion of Immigrants from Belize and unemployment rate among population between the ages 65 and 74 in the United States with a correlation coefficient (R) of -0.220 and weighted average of 5.5%, a difference of 7.3%.
Unemployment Among Ages 65 to 74 years Correlation Summary
| Measurement | Aleut | Immigrants from Belize |
| Minimum | 4.1% | 0.10% |
| Maximum | 66.7% | 11.4% |
| Range | 62.6% | 11.3% |
| Mean | 19.0% | 5.2% |
| Median | 9.8% | 5.3% |
| Interquartile 25% (IQ1) | 7.2% | 3.6% |
| Interquartile 75% (IQ3) | 23.1% | 6.6% |
| Interquartile Range (IQR) | 15.9% | 3.0% |
| Standard Deviation (Sample) | 20.4% | 2.2% |
| Standard Deviation (Population) | 19.9% | 2.2% |
Similar Demographics by Unemployment Among Ages 65 to 74 years
Demographics Similar to Aleuts by Unemployment Among Ages 65 to 74 years
In terms of unemployment among ages 65 to 74 years, the demographic groups most similar to Aleuts are Zimbabwean (5.9%, a difference of 0.020%), Immigrants from Bahamas (5.9%, a difference of 0.090%), Immigrants from Central America (5.9%, a difference of 0.29%), Immigrants from Dominica (6.0%, a difference of 0.46%), and Immigrants from Mexico (6.0%, a difference of 0.68%).
| Demographics | Rating | Rank | Unemployment Among Ages 65 to 74 years |
| Hispanics or Latinos | 0.0 /100 | #312 | Tragic 5.9% |
| Vietnamese | 0.0 /100 | #313 | Tragic 5.9% |
| Immigrants | Venezuela | 0.0 /100 | #314 | Tragic 5.9% |
| Immigrants | Guatemala | 0.0 /100 | #315 | Tragic 5.9% |
| Immigrants | El Salvador | 0.0 /100 | #316 | Tragic 5.9% |
| Immigrants | Central America | 0.0 /100 | #317 | Tragic 5.9% |
| Zimbabweans | 0.0 /100 | #318 | Tragic 5.9% |
| Aleuts | 0.0 /100 | #319 | Tragic 5.9% |
| Immigrants | Bahamas | 0.0 /100 | #320 | Tragic 5.9% |
| Immigrants | Dominica | 0.0 /100 | #321 | Tragic 6.0% |
| Immigrants | Mexico | 0.0 /100 | #322 | Tragic 6.0% |
| Delaware | 0.0 /100 | #323 | Tragic 6.0% |
| Tohono O'odham | 0.0 /100 | #324 | Tragic 6.0% |
| Immigrants | Portugal | 0.0 /100 | #325 | Tragic 6.0% |
| Natives/Alaskans | 0.0 /100 | #326 | Tragic 6.0% |
Demographics Similar to Immigrants from Belize by Unemployment Among Ages 65 to 74 years
In terms of unemployment among ages 65 to 74 years, the demographic groups most similar to Immigrants from Belize are Hopi (5.5%, a difference of 0.0%), Peruvian (5.5%, a difference of 0.010%), French American Indian (5.5%, a difference of 0.020%), South American Indian (5.5%, a difference of 0.030%), and Nigerian (5.5%, a difference of 0.12%).
| Demographics | Rating | Rank | Unemployment Among Ages 65 to 74 years |
| Immigrants | Caribbean | 2.7 /100 | #230 | Tragic 5.5% |
| Israelis | 2.5 /100 | #231 | Tragic 5.5% |
| Nigerians | 2.5 /100 | #232 | Tragic 5.5% |
| South American Indians | 2.3 /100 | #233 | Tragic 5.5% |
| French American Indians | 2.2 /100 | #234 | Tragic 5.5% |
| Peruvians | 2.2 /100 | #235 | Tragic 5.5% |
| Hopi | 2.2 /100 | #236 | Tragic 5.5% |
| Immigrants | Belize | 2.2 /100 | #237 | Tragic 5.5% |
| Cajuns | 1.8 /100 | #238 | Tragic 5.5% |
| German Russians | 1.6 /100 | #239 | Tragic 5.5% |
| Ghanaians | 1.4 /100 | #240 | Tragic 5.6% |
| Cree | 1.4 /100 | #241 | Tragic 5.6% |
| Immigrants | Ghana | 1.4 /100 | #242 | Tragic 5.6% |
| Immigrants | Peru | 1.3 /100 | #243 | Tragic 5.6% |
| Immigrants | Micronesia | 0.9 /100 | #244 | Tragic 5.6% |