Immigrants from Western Africa vs Immigrants from Northern Africa In Labor Force | Age > 16
COMPARE
Immigrants from Western Africa
Immigrants from Northern Africa
In Labor Force | Age > 16
In Labor Force | Age > 16 Comparison
Immigrants from Western Africa
Immigrants from Northern Africa
67.1%
IN LABOR FORCE | AGE > 16
100.0/ 100
METRIC RATING
36th/ 347
METRIC RANK
66.6%
IN LABOR FORCE | AGE > 16
100.0/ 100
METRIC RATING
49th/ 347
METRIC RANK
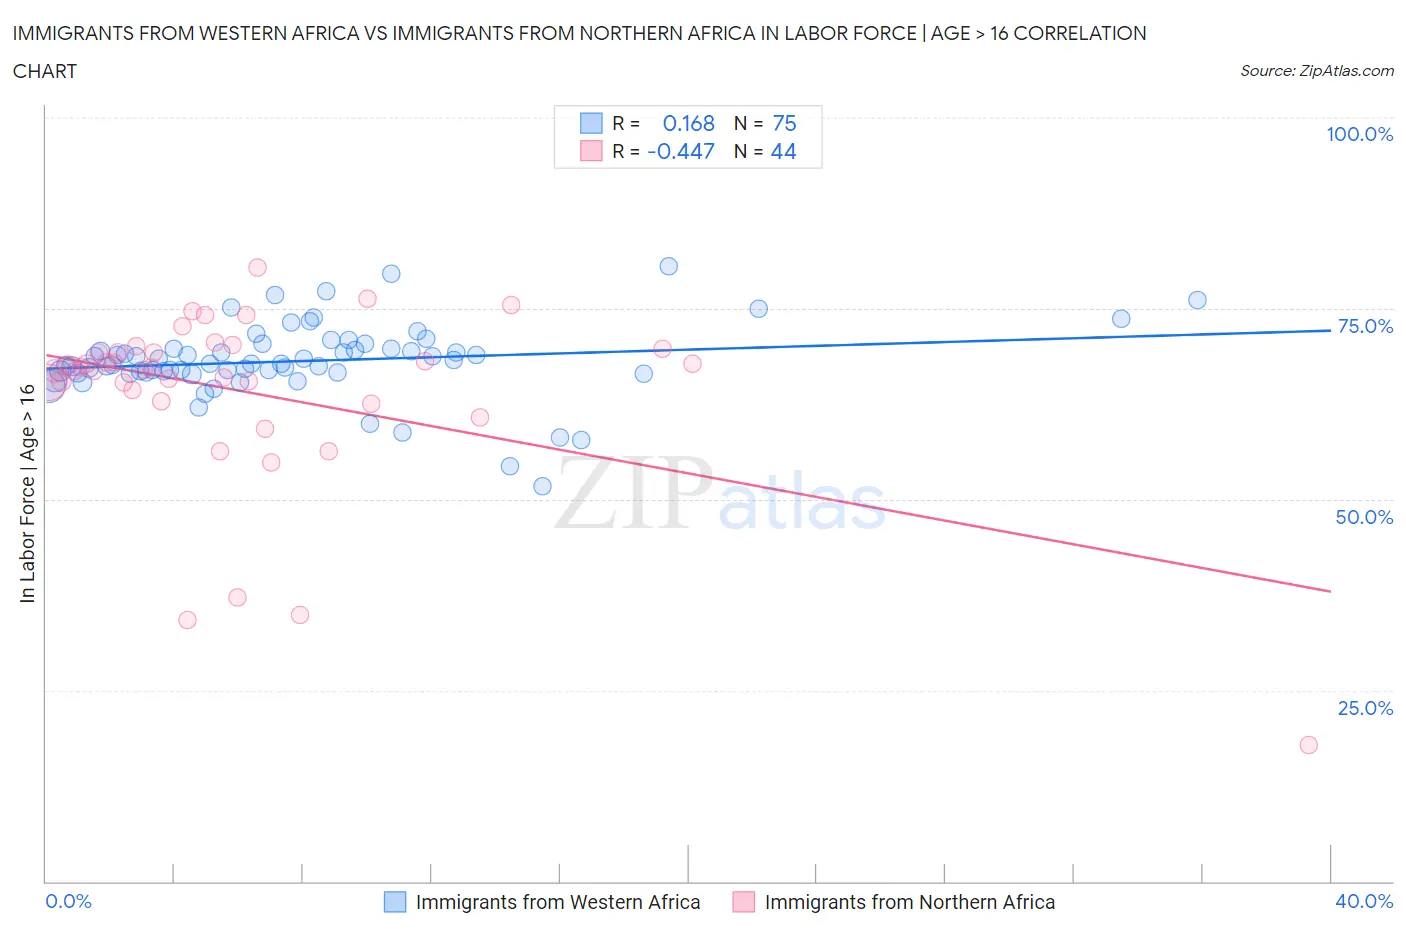
Immigrants from Western Africa vs Immigrants from Northern Africa In Labor Force | Age > 16 Correlation Chart
The statistical analysis conducted on geographies consisting of 357,882,525 people shows a poor positive correlation between the proportion of Immigrants from Western Africa and labor force participation rate among population ages 16 and over in the United States with a correlation coefficient (R) of 0.168 and weighted average of 67.1%. Similarly, the statistical analysis conducted on geographies consisting of 321,205,048 people shows a moderate negative correlation between the proportion of Immigrants from Northern Africa and labor force participation rate among population ages 16 and over in the United States with a correlation coefficient (R) of -0.447 and weighted average of 66.6%, a difference of 0.69%.
In Labor Force | Age > 16 Correlation Summary
| Measurement | Immigrants from Western Africa | Immigrants from Northern Africa |
| Minimum | 51.7% | 17.9% |
| Maximum | 80.6% | 80.4% |
| Range | 28.9% | 62.5% |
| Mean | 68.1% | 64.1% |
| Median | 67.8% | 67.2% |
| Interquartile 25% (IQ1) | 66.6% | 63.6% |
| Interquartile 75% (IQ3) | 69.8% | 69.5% |
| Interquartile Range (IQR) | 3.2% | 5.8% |
| Standard Deviation (Sample) | 4.9% | 12.0% |
| Standard Deviation (Population) | 4.8% | 11.8% |
Demographics Similar to Immigrants from Western Africa and Immigrants from Northern Africa by In Labor Force | Age > 16
In terms of in labor force | age > 16, the demographic groups most similar to Immigrants from Western Africa are Immigrants from South Central Asia (67.1%, a difference of 0.0%), Immigrants from Ghana (67.1%, a difference of 0.050%), Immigrants from Congo (67.1%, a difference of 0.070%), Afghan (67.1%, a difference of 0.070%), and Immigrants from Afghanistan (67.0%, a difference of 0.080%). Similarly, the demographic groups most similar to Immigrants from Northern Africa are Nigerian (66.6%, a difference of 0.020%), Brazilian (66.6%, a difference of 0.030%), Immigrants from Bulgaria (66.6%, a difference of 0.030%), Cape Verdean (66.6%, a difference of 0.050%), and Immigrants from Brazil (66.7%, a difference of 0.10%).
| Demographics | Rating | Rank | In Labor Force | Age > 16 |
| Immigrants | Congo | 100.0 /100 | #32 | Exceptional 67.1% |
| Afghans | 100.0 /100 | #33 | Exceptional 67.1% |
| Immigrants | Ghana | 100.0 /100 | #34 | Exceptional 67.1% |
| Immigrants | South Central Asia | 100.0 /100 | #35 | Exceptional 67.1% |
| Immigrants | Western Africa | 100.0 /100 | #36 | Exceptional 67.1% |
| Immigrants | Afghanistan | 100.0 /100 | #37 | Exceptional 67.0% |
| Immigrants | Nigeria | 100.0 /100 | #38 | Exceptional 66.9% |
| Salvadorans | 100.0 /100 | #39 | Exceptional 66.8% |
| Immigrants | El Salvador | 100.0 /100 | #40 | Exceptional 66.8% |
| Immigrants | Zimbabwe | 100.0 /100 | #41 | Exceptional 66.8% |
| Senegalese | 100.0 /100 | #42 | Exceptional 66.7% |
| Luxembourgers | 100.0 /100 | #43 | Exceptional 66.7% |
| Immigrants | Pakistan | 100.0 /100 | #44 | Exceptional 66.7% |
| Immigrants | Brazil | 100.0 /100 | #45 | Exceptional 66.7% |
| Brazilians | 100.0 /100 | #46 | Exceptional 66.6% |
| Immigrants | Bulgaria | 100.0 /100 | #47 | Exceptional 66.6% |
| Nigerians | 100.0 /100 | #48 | Exceptional 66.6% |
| Immigrants | Northern Africa | 100.0 /100 | #49 | Exceptional 66.6% |
| Cape Verdeans | 100.0 /100 | #50 | Exceptional 66.6% |
| Immigrants | Kuwait | 100.0 /100 | #51 | Exceptional 66.5% |
| Paraguayans | 99.9 /100 | #52 | Exceptional 66.5% |