Bahamian vs Syrian In Labor Force | Age 30-34
COMPARE
Bahamian
Syrian
In Labor Force | Age 30-34
In Labor Force | Age 30-34 Comparison
Bahamians
Syrians
83.9%
IN LABOR FORCE | AGE 30-34
0.6/ 100
METRIC RATING
252nd/ 347
METRIC RANK
84.8%
IN LABOR FORCE | AGE 30-34
70.1/ 100
METRIC RATING
153rd/ 347
METRIC RANK
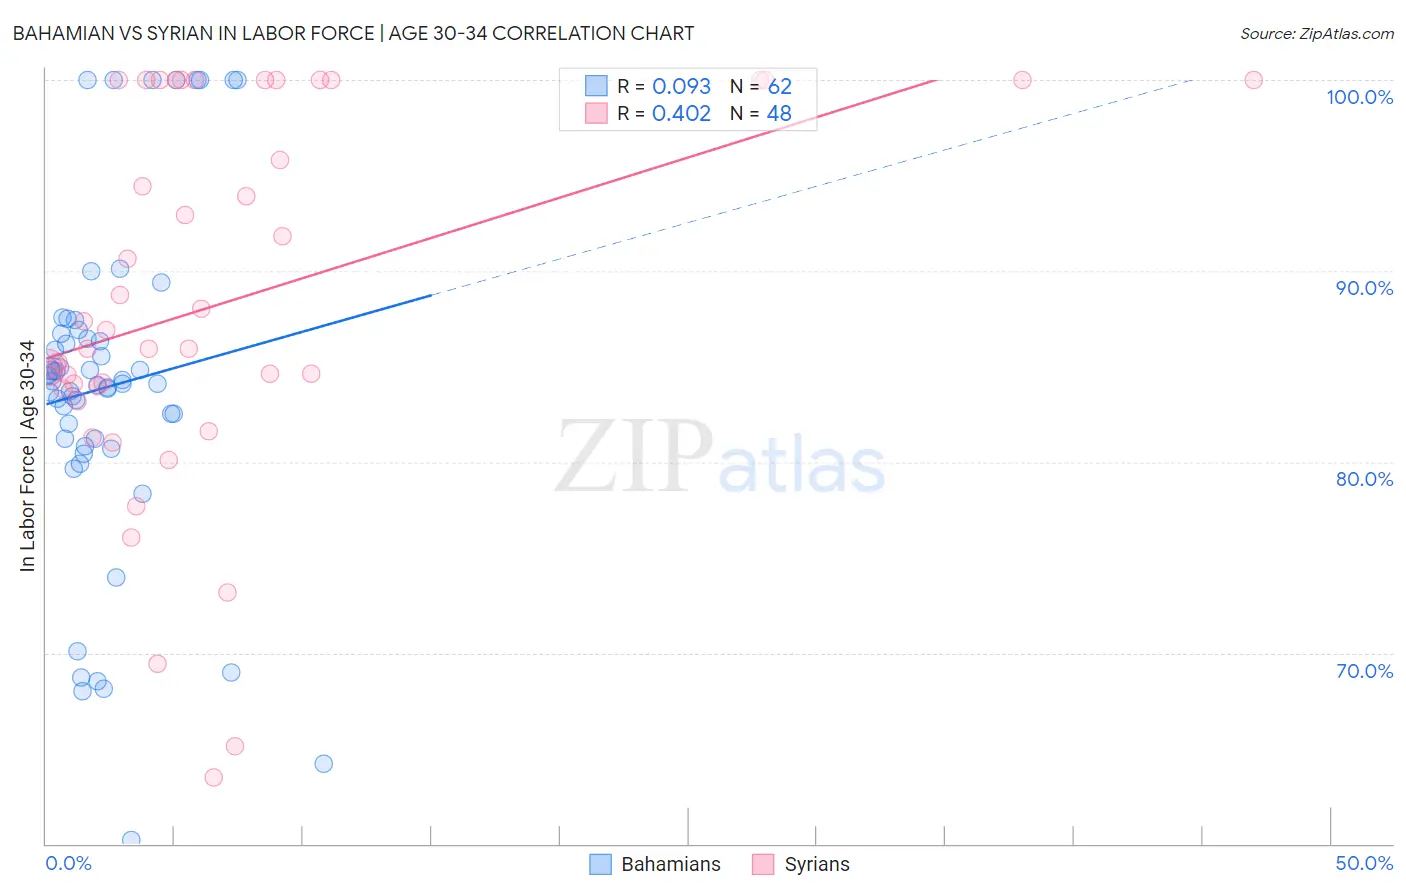
Bahamian vs Syrian In Labor Force | Age 30-34 Correlation Chart
The statistical analysis conducted on geographies consisting of 112,639,396 people shows a slight positive correlation between the proportion of Bahamians and labor force participation rate among population between the ages 30 and 34 in the United States with a correlation coefficient (R) of 0.093 and weighted average of 83.9%. Similarly, the statistical analysis conducted on geographies consisting of 266,193,214 people shows a moderate positive correlation between the proportion of Syrians and labor force participation rate among population between the ages 30 and 34 in the United States with a correlation coefficient (R) of 0.402 and weighted average of 84.8%, a difference of 1.1%.
In Labor Force | Age 30-34 Correlation Summary
| Measurement | Bahamian | Syrian |
| Minimum | 60.2% | 63.5% |
| Maximum | 100.0% | 100.0% |
| Range | 39.8% | 36.5% |
| Mean | 83.9% | 88.4% |
| Median | 84.2% | 86.4% |
| Interquartile 25% (IQ1) | 81.2% | 83.9% |
| Interquartile 75% (IQ3) | 86.7% | 100.0% |
| Interquartile Range (IQR) | 5.5% | 16.1% |
| Standard Deviation (Sample) | 8.9% | 9.8% |
| Standard Deviation (Population) | 8.8% | 9.7% |
Similar Demographics by In Labor Force | Age 30-34
Demographics Similar to Bahamians by In Labor Force | Age 30-34
In terms of in labor force | age 30-34, the demographic groups most similar to Bahamians are Nicaraguan (83.9%, a difference of 0.0%), Immigrants from Nicaragua (83.9%, a difference of 0.0%), Immigrants from Iraq (83.9%, a difference of 0.020%), Immigrants from St. Vincent and the Grenadines (83.9%, a difference of 0.020%), and Portuguese (84.0%, a difference of 0.040%).
| Demographics | Rating | Rank | In Labor Force | Age 30-34 |
| Immigrants | Venezuela | 0.9 /100 | #245 | Tragic 84.0% |
| Central Americans | 0.9 /100 | #246 | Tragic 84.0% |
| British West Indians | 0.8 /100 | #247 | Tragic 84.0% |
| Portuguese | 0.8 /100 | #248 | Tragic 84.0% |
| Immigrants | Dominica | 0.7 /100 | #249 | Tragic 84.0% |
| Immigrants | Iraq | 0.7 /100 | #250 | Tragic 83.9% |
| Nicaraguans | 0.6 /100 | #251 | Tragic 83.9% |
| Bahamians | 0.6 /100 | #252 | Tragic 83.9% |
| Immigrants | Nicaragua | 0.6 /100 | #253 | Tragic 83.9% |
| Immigrants | St. Vincent and the Grenadines | 0.5 /100 | #254 | Tragic 83.9% |
| Whites/Caucasians | 0.5 /100 | #255 | Tragic 83.9% |
| Immigrants | Lebanon | 0.4 /100 | #256 | Tragic 83.9% |
| Iraqis | 0.3 /100 | #257 | Tragic 83.8% |
| Hondurans | 0.3 /100 | #258 | Tragic 83.8% |
| Scotch-Irish | 0.3 /100 | #259 | Tragic 83.8% |
Demographics Similar to Syrians by In Labor Force | Age 30-34
In terms of in labor force | age 30-34, the demographic groups most similar to Syrians are Northern European (84.8%, a difference of 0.0%), Immigrants from Sudan (84.8%, a difference of 0.0%), French Canadian (84.8%, a difference of 0.020%), Immigrants from Senegal (84.8%, a difference of 0.030%), and Romanian (84.8%, a difference of 0.030%).
| Demographics | Rating | Rank | In Labor Force | Age 30-34 |
| Immigrants | Saudi Arabia | 76.6 /100 | #146 | Good 84.9% |
| Immigrants | Colombia | 76.3 /100 | #147 | Good 84.9% |
| Immigrants | Pakistan | 76.2 /100 | #148 | Good 84.9% |
| Immigrants | Ukraine | 75.1 /100 | #149 | Good 84.8% |
| Germans | 75.1 /100 | #150 | Good 84.8% |
| Immigrants | Senegal | 74.0 /100 | #151 | Good 84.8% |
| Romanians | 73.5 /100 | #152 | Good 84.8% |
| Syrians | 70.1 /100 | #153 | Good 84.8% |
| Northern Europeans | 70.0 /100 | #154 | Good 84.8% |
| Immigrants | Sudan | 69.5 /100 | #155 | Good 84.8% |
| French Canadians | 67.3 /100 | #156 | Good 84.8% |
| Peruvians | 65.9 /100 | #157 | Good 84.8% |
| Immigrants | Armenia | 64.7 /100 | #158 | Good 84.8% |
| Czechoslovakians | 63.0 /100 | #159 | Good 84.8% |
| Pakistanis | 60.8 /100 | #160 | Good 84.7% |