Jordanian vs Pakistani In Labor Force | Age 45-54
COMPARE
Jordanian
Pakistani
In Labor Force | Age 45-54
In Labor Force | Age 45-54 Comparison
Jordanians
Pakistanis
83.4%
IN LABOR FORCE | AGE 45-54
96.4/ 100
METRIC RATING
81st/ 347
METRIC RANK
82.8%
IN LABOR FORCE | AGE 45-54
53.2/ 100
METRIC RATING
170th/ 347
METRIC RANK
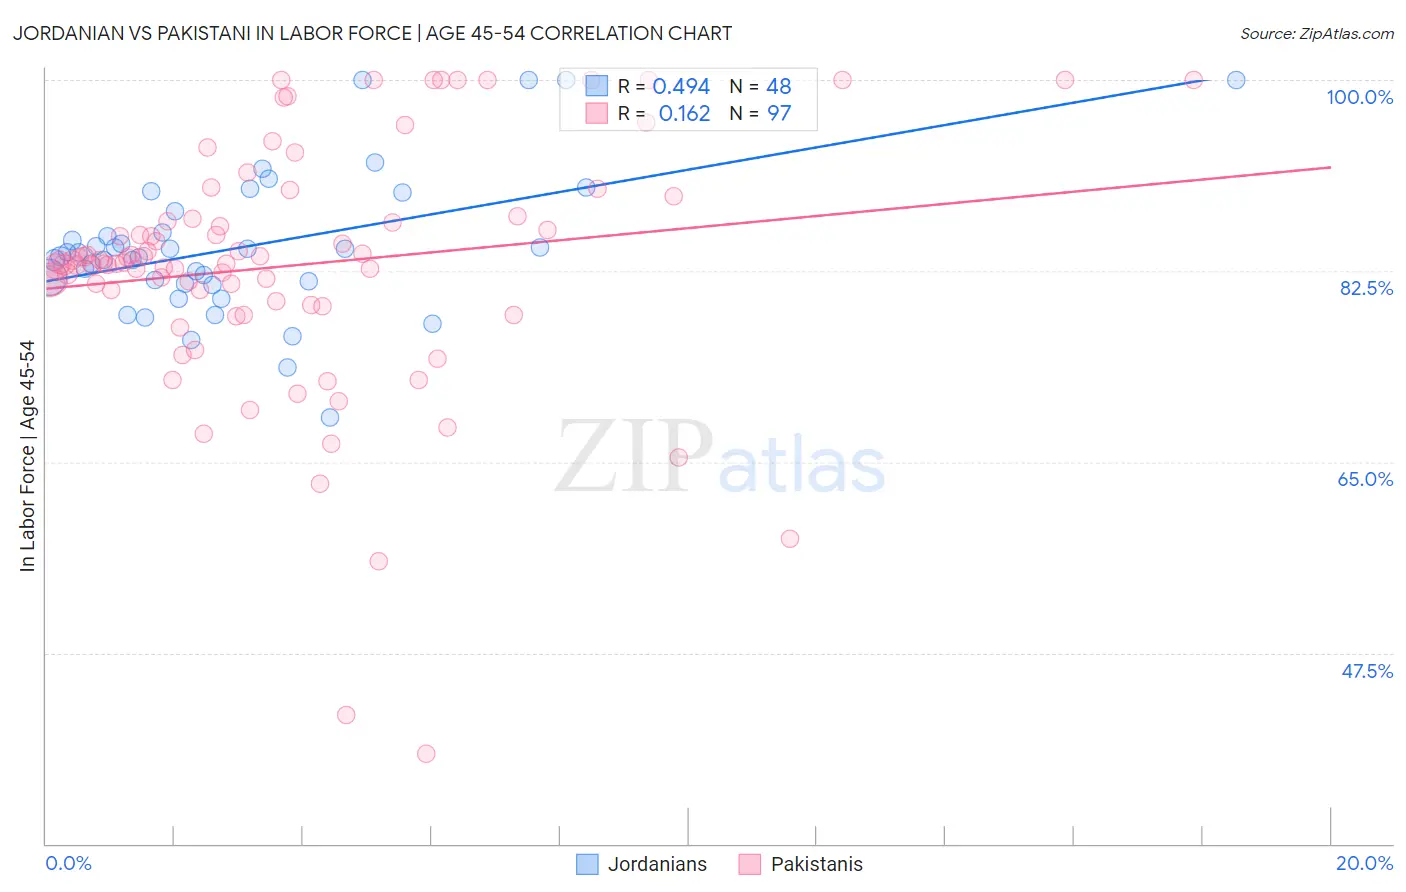
Jordanian vs Pakistani In Labor Force | Age 45-54 Correlation Chart
The statistical analysis conducted on geographies consisting of 166,384,997 people shows a moderate positive correlation between the proportion of Jordanians and labor force participation rate among population between the ages 45 and 54 in the United States with a correlation coefficient (R) of 0.494 and weighted average of 83.4%. Similarly, the statistical analysis conducted on geographies consisting of 335,175,573 people shows a poor positive correlation between the proportion of Pakistanis and labor force participation rate among population between the ages 45 and 54 in the United States with a correlation coefficient (R) of 0.162 and weighted average of 82.8%, a difference of 0.70%.
In Labor Force | Age 45-54 Correlation Summary
| Measurement | Jordanian | Pakistani |
| Minimum | 69.1% | 38.2% |
| Maximum | 100.0% | 100.0% |
| Range | 30.9% | 61.8% |
| Mean | 84.7% | 83.0% |
| Median | 84.0% | 83.2% |
| Interquartile 25% (IQ1) | 81.5% | 79.5% |
| Interquartile 75% (IQ3) | 87.0% | 87.4% |
| Interquartile Range (IQR) | 5.6% | 7.9% |
| Standard Deviation (Sample) | 6.5% | 11.4% |
| Standard Deviation (Population) | 6.5% | 11.3% |
Similar Demographics by In Labor Force | Age 45-54
Demographics Similar to Jordanians by In Labor Force | Age 45-54
In terms of in labor force | age 45-54, the demographic groups most similar to Jordanians are Immigrants from Croatia (83.4%, a difference of 0.0%), Immigrants from Egypt (83.4%, a difference of 0.010%), Belgian (83.4%, a difference of 0.010%), Immigrants from Eastern Asia (83.4%, a difference of 0.010%), and Immigrants from Zimbabwe (83.4%, a difference of 0.010%).
| Demographics | Rating | Rank | In Labor Force | Age 45-54 |
| Immigrants | Somalia | 96.9 /100 | #74 | Exceptional 83.4% |
| Estonians | 96.9 /100 | #75 | Exceptional 83.4% |
| Russians | 96.8 /100 | #76 | Exceptional 83.4% |
| Cubans | 96.7 /100 | #77 | Exceptional 83.4% |
| Immigrants | Egypt | 96.6 /100 | #78 | Exceptional 83.4% |
| Belgians | 96.5 /100 | #79 | Exceptional 83.4% |
| Immigrants | Croatia | 96.5 /100 | #80 | Exceptional 83.4% |
| Jordanians | 96.4 /100 | #81 | Exceptional 83.4% |
| Immigrants | Eastern Asia | 96.3 /100 | #82 | Exceptional 83.4% |
| Immigrants | Zimbabwe | 96.3 /100 | #83 | Exceptional 83.4% |
| Immigrants | Bosnia and Herzegovina | 96.0 /100 | #84 | Exceptional 83.3% |
| Greeks | 95.9 /100 | #85 | Exceptional 83.3% |
| Immigrants | Northern Africa | 95.7 /100 | #86 | Exceptional 83.3% |
| Immigrants | Eastern Europe | 95.6 /100 | #87 | Exceptional 83.3% |
| Immigrants | Asia | 95.6 /100 | #88 | Exceptional 83.3% |
Demographics Similar to Pakistanis by In Labor Force | Age 45-54
In terms of in labor force | age 45-54, the demographic groups most similar to Pakistanis are Immigrants from Zaire (82.8%, a difference of 0.0%), Immigrants from Western Africa (82.8%, a difference of 0.010%), Icelander (82.8%, a difference of 0.010%), Immigrants from South Africa (82.8%, a difference of 0.020%), and Swiss (82.8%, a difference of 0.030%).
| Demographics | Rating | Rank | In Labor Force | Age 45-54 |
| Dutch | 61.7 /100 | #163 | Good 82.8% |
| German Russians | 61.3 /100 | #164 | Good 82.8% |
| Immigrants | Sudan | 59.9 /100 | #165 | Average 82.8% |
| Immigrants | South Eastern Asia | 57.4 /100 | #166 | Average 82.8% |
| Swiss | 56.5 /100 | #167 | Average 82.8% |
| Immigrants | South Africa | 55.8 /100 | #168 | Average 82.8% |
| Immigrants | Western Africa | 54.1 /100 | #169 | Average 82.8% |
| Pakistanis | 53.2 /100 | #170 | Average 82.8% |
| Immigrants | Zaire | 52.9 /100 | #171 | Average 82.8% |
| Icelanders | 51.8 /100 | #172 | Average 82.8% |
| Nicaraguans | 50.3 /100 | #173 | Average 82.8% |
| Costa Ricans | 50.0 /100 | #174 | Average 82.8% |
| Immigrants | Liberia | 47.9 /100 | #175 | Average 82.7% |
| Northern Europeans | 46.9 /100 | #176 | Average 82.7% |
| Immigrants | Nicaragua | 44.6 /100 | #177 | Average 82.7% |