Arab vs Immigrants from Costa Rica In Labor Force | Age 45-54
COMPARE
Arab
Immigrants from Costa Rica
In Labor Force | Age 45-54
In Labor Force | Age 45-54 Comparison
Arabs
Immigrants from Costa Rica
82.4%
IN LABOR FORCE | AGE 45-54
11.6/ 100
METRIC RATING
203rd/ 347
METRIC RANK
82.6%
IN LABOR FORCE | AGE 45-54
28.3/ 100
METRIC RATING
187th/ 347
METRIC RANK
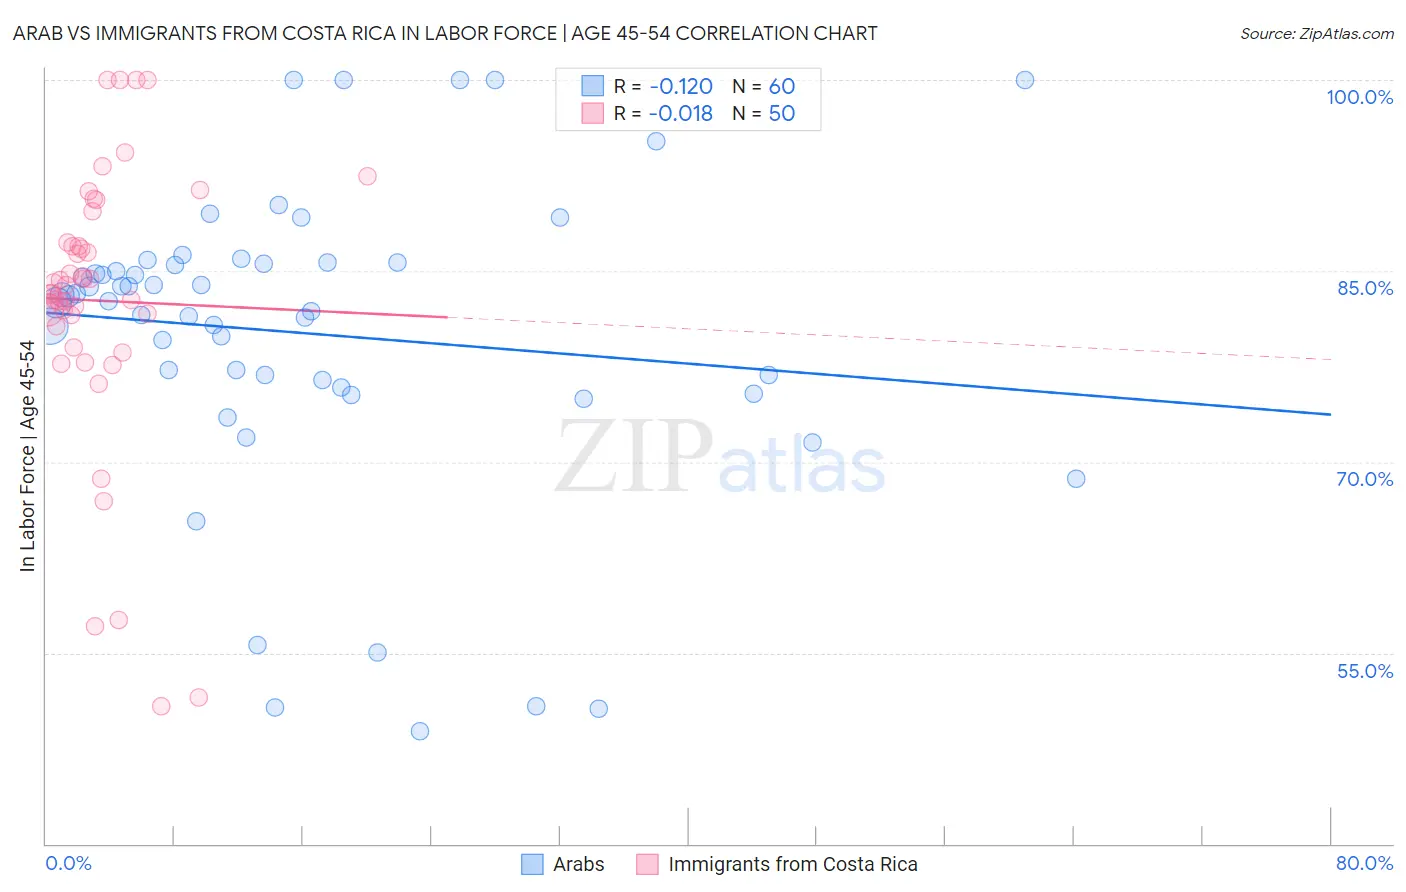
Arab vs Immigrants from Costa Rica In Labor Force | Age 45-54 Correlation Chart
The statistical analysis conducted on geographies consisting of 486,354,734 people shows a poor negative correlation between the proportion of Arabs and labor force participation rate among population between the ages 45 and 54 in the United States with a correlation coefficient (R) of -0.120 and weighted average of 82.4%. Similarly, the statistical analysis conducted on geographies consisting of 204,239,151 people shows no correlation between the proportion of Immigrants from Costa Rica and labor force participation rate among population between the ages 45 and 54 in the United States with a correlation coefficient (R) of -0.018 and weighted average of 82.6%, a difference of 0.24%.
In Labor Force | Age 45-54 Correlation Summary
| Measurement | Arab | Immigrants from Costa Rica |
| Minimum | 48.8% | 50.8% |
| Maximum | 100.0% | 100.0% |
| Range | 51.2% | 49.2% |
| Mean | 80.1% | 82.7% |
| Median | 82.8% | 83.5% |
| Interquartile 25% (IQ1) | 76.1% | 80.6% |
| Interquartile 75% (IQ3) | 85.6% | 87.2% |
| Interquartile Range (IQR) | 9.5% | 6.6% |
| Standard Deviation (Sample) | 12.0% | 10.9% |
| Standard Deviation (Population) | 11.9% | 10.8% |
Demographics Similar to Arabs and Immigrants from Costa Rica by In Labor Force | Age 45-54
In terms of in labor force | age 45-54, the demographic groups most similar to Arabs are Immigrants from Western Europe (82.4%, a difference of 0.010%), Senegalese (82.4%, a difference of 0.050%), Immigrants from Western Asia (82.4%, a difference of 0.060%), French Canadian (82.5%, a difference of 0.070%), and Canadian (82.4%, a difference of 0.070%). Similarly, the demographic groups most similar to Immigrants from Costa Rica are South African (82.6%, a difference of 0.0%), Irish (82.6%, a difference of 0.010%), Syrian (82.6%, a difference of 0.030%), British (82.6%, a difference of 0.030%), and Immigrants from England (82.6%, a difference of 0.040%).
| Demographics | Rating | Rank | In Labor Force | Age 45-54 |
| Immigrants | England | 32.2 /100 | #185 | Fair 82.6% |
| Irish | 29.2 /100 | #186 | Fair 82.6% |
| Immigrants | Costa Rica | 28.3 /100 | #187 | Fair 82.6% |
| South Africans | 28.0 /100 | #188 | Fair 82.6% |
| Syrians | 26.0 /100 | #189 | Fair 82.6% |
| British | 25.7 /100 | #190 | Fair 82.6% |
| Armenians | 23.2 /100 | #191 | Fair 82.5% |
| Immigrants | Iraq | 20.9 /100 | #192 | Fair 82.5% |
| Australians | 20.8 /100 | #193 | Fair 82.5% |
| Immigrants | Norway | 20.7 /100 | #194 | Fair 82.5% |
| Immigrants | Canada | 20.0 /100 | #195 | Fair 82.5% |
| Immigrants | North America | 18.8 /100 | #196 | Poor 82.5% |
| Lebanese | 18.2 /100 | #197 | Poor 82.5% |
| Immigrants | Denmark | 17.9 /100 | #198 | Poor 82.5% |
| Moroccans | 15.7 /100 | #199 | Poor 82.5% |
| French Canadians | 15.4 /100 | #200 | Poor 82.5% |
| Canadians | 15.1 /100 | #201 | Poor 82.4% |
| Immigrants | Western Asia | 14.9 /100 | #202 | Poor 82.4% |
| Arabs | 11.6 /100 | #203 | Poor 82.4% |
| Immigrants | Western Europe | 10.9 /100 | #204 | Poor 82.4% |
| Senegalese | 9.5 /100 | #205 | Tragic 82.4% |