Immigrants from Russia vs Immigrants from Poland Householder Income Ages 25 - 44 years
COMPARE
Immigrants from Russia
Immigrants from Poland
Householder Income Ages 25 - 44 years
Householder Income Ages 25 - 44 years Comparison
Immigrants from Russia
Immigrants from Poland
$108,751
HOUSEHOLDER INCOME AGES 25 - 44 YEARS
100.0/ 100
METRIC RATING
37th/ 347
METRIC RANK
$101,065
HOUSEHOLDER INCOME AGES 25 - 44 YEARS
97.4/ 100
METRIC RATING
104th/ 347
METRIC RANK
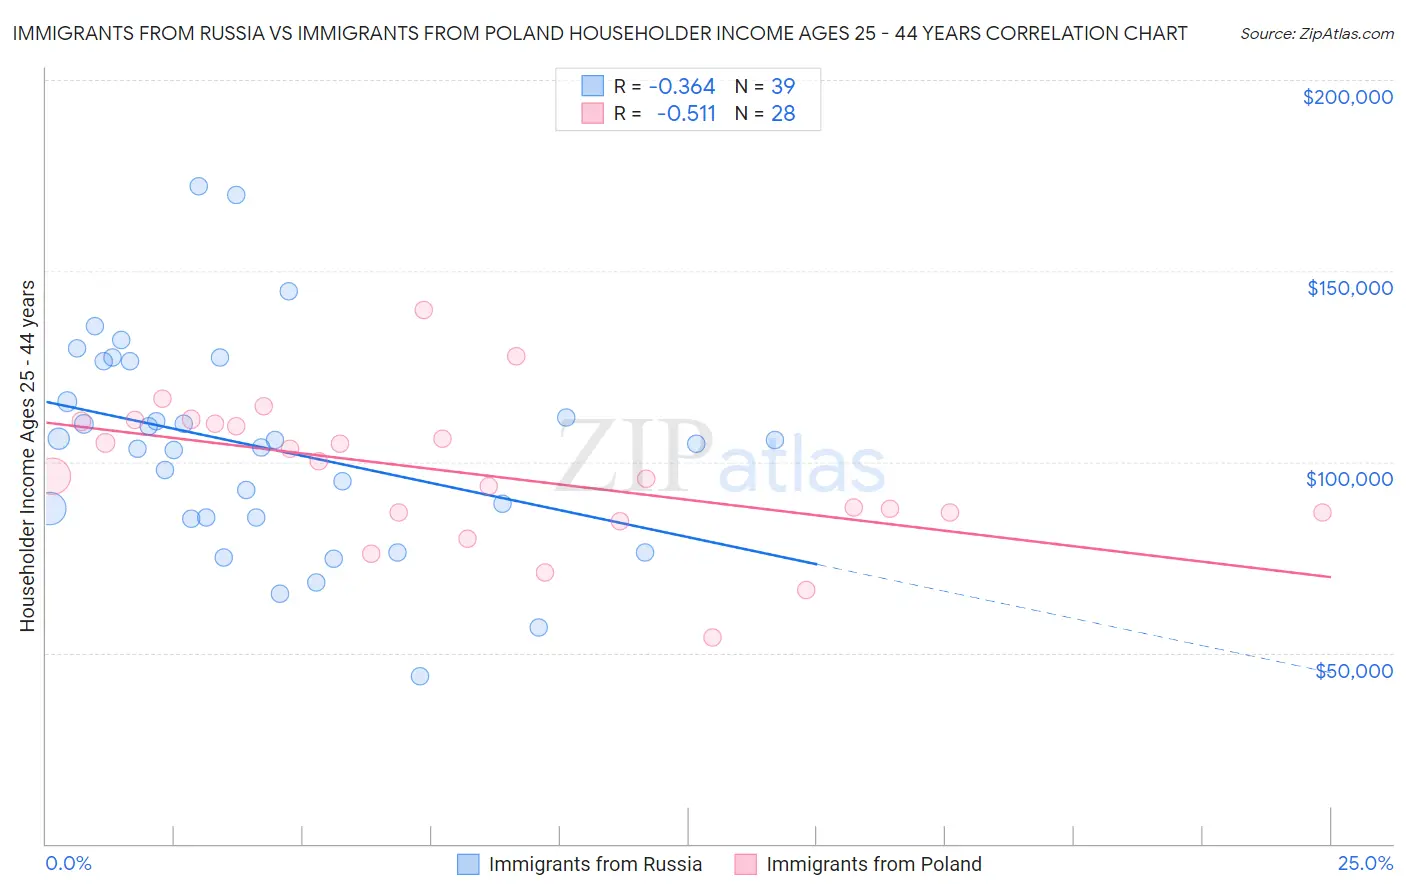
Immigrants from Russia vs Immigrants from Poland Householder Income Ages 25 - 44 years Correlation Chart
The statistical analysis conducted on geographies consisting of 347,220,944 people shows a mild negative correlation between the proportion of Immigrants from Russia and household income with householder between the ages 25 and 44 in the United States with a correlation coefficient (R) of -0.364 and weighted average of $108,751. Similarly, the statistical analysis conducted on geographies consisting of 304,269,363 people shows a substantial negative correlation between the proportion of Immigrants from Poland and household income with householder between the ages 25 and 44 in the United States with a correlation coefficient (R) of -0.511 and weighted average of $101,065, a difference of 7.6%.
Householder Income Ages 25 - 44 years Correlation Summary
| Measurement | Immigrants from Russia | Immigrants from Poland |
| Minimum | $43,724 | $53,849 |
| Maximum | $172,064 | $139,903 |
| Range | $128,340 | $86,054 |
| Mean | $103,731 | $97,277 |
| Median | $104,773 | $98,174 |
| Interquartile 25% (IQ1) | $85,291 | $86,748 |
| Interquartile 75% (IQ3) | $126,225 | $110,162 |
| Interquartile Range (IQR) | $40,934 | $23,414 |
| Standard Deviation (Sample) | $27,697 | $18,764 |
| Standard Deviation (Population) | $27,339 | $18,426 |
Similar Demographics by Householder Income Ages 25 - 44 years
Demographics Similar to Immigrants from Russia by Householder Income Ages 25 - 44 years
In terms of householder income ages 25 - 44 years, the demographic groups most similar to Immigrants from Russia are Latvian ($108,926, a difference of 0.16%), Soviet Union ($108,457, a difference of 0.27%), Immigrants from Switzerland ($109,185, a difference of 0.40%), Immigrants from France ($108,257, a difference of 0.46%), and Immigrants from Lithuania ($108,149, a difference of 0.56%).
| Demographics | Rating | Rank | Householder Income Ages 25 - 44 years |
| Immigrants | Greece | 100.0 /100 | #30 | Exceptional $110,103 |
| Maltese | 100.0 /100 | #31 | Exceptional $110,064 |
| Immigrants | Sri Lanka | 100.0 /100 | #32 | Exceptional $109,741 |
| Bhutanese | 100.0 /100 | #33 | Exceptional $109,520 |
| Bolivians | 100.0 /100 | #34 | Exceptional $109,372 |
| Immigrants | Switzerland | 100.0 /100 | #35 | Exceptional $109,185 |
| Latvians | 100.0 /100 | #36 | Exceptional $108,926 |
| Immigrants | Russia | 100.0 /100 | #37 | Exceptional $108,751 |
| Soviet Union | 100.0 /100 | #38 | Exceptional $108,457 |
| Immigrants | France | 99.9 /100 | #39 | Exceptional $108,257 |
| Immigrants | Lithuania | 99.9 /100 | #40 | Exceptional $108,149 |
| Immigrants | Bolivia | 99.9 /100 | #41 | Exceptional $108,128 |
| Australians | 99.9 /100 | #42 | Exceptional $107,912 |
| Immigrants | Malaysia | 99.9 /100 | #43 | Exceptional $107,650 |
| Immigrants | Indonesia | 99.9 /100 | #44 | Exceptional $107,627 |
Demographics Similar to Immigrants from Poland by Householder Income Ages 25 - 44 years
In terms of householder income ages 25 - 44 years, the demographic groups most similar to Immigrants from Poland are Immigrants from Moldova ($101,091, a difference of 0.030%), Immigrants from Lebanon ($101,124, a difference of 0.060%), Albanian ($101,367, a difference of 0.30%), Immigrants from Argentina ($101,415, a difference of 0.35%), and Taiwanese ($101,492, a difference of 0.42%).
| Demographics | Rating | Rank | Householder Income Ages 25 - 44 years |
| Austrians | 98.3 /100 | #97 | Exceptional $101,842 |
| Immigrants | Kazakhstan | 98.1 /100 | #98 | Exceptional $101,727 |
| Taiwanese | 97.9 /100 | #99 | Exceptional $101,492 |
| Immigrants | Argentina | 97.8 /100 | #100 | Exceptional $101,415 |
| Albanians | 97.8 /100 | #101 | Exceptional $101,367 |
| Immigrants | Lebanon | 97.4 /100 | #102 | Exceptional $101,124 |
| Immigrants | Moldova | 97.4 /100 | #103 | Exceptional $101,091 |
| Immigrants | Poland | 97.4 /100 | #104 | Exceptional $101,065 |
| Immigrants | Vietnam | 96.5 /100 | #105 | Exceptional $100,535 |
| Immigrants | Brazil | 96.5 /100 | #106 | Exceptional $100,534 |
| Northern Europeans | 96.3 /100 | #107 | Exceptional $100,457 |
| Immigrants | South Eastern Asia | 96.0 /100 | #108 | Exceptional $100,283 |
| Immigrants | North Macedonia | 95.6 /100 | #109 | Exceptional $100,101 |
| Immigrants | Afghanistan | 95.3 /100 | #110 | Exceptional $99,977 |
| Chileans | 95.1 /100 | #111 | Exceptional $99,900 |