Afghan vs Immigrants from Nicaragua Per Capita Income
COMPARE
Afghan
Immigrants from Nicaragua
Per Capita Income
Per Capita Income Comparison
Afghans
Immigrants from Nicaragua
$46,268
PER CAPITA INCOME
94.9/ 100
METRIC RATING
114th/ 347
METRIC RANK
$38,065
PER CAPITA INCOME
0.2/ 100
METRIC RATING
278th/ 347
METRIC RANK
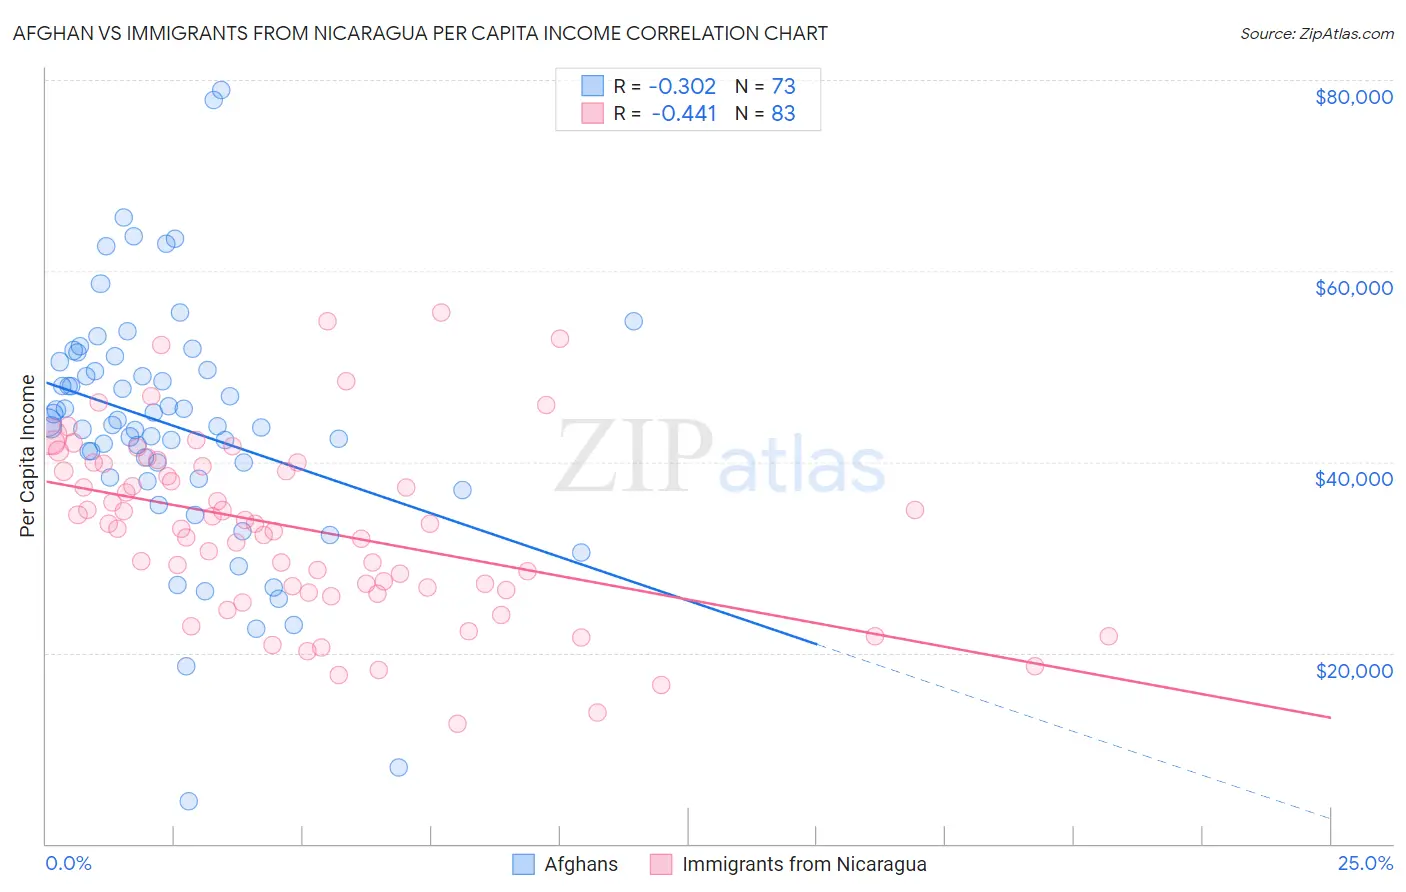
Afghan vs Immigrants from Nicaragua Per Capita Income Correlation Chart
The statistical analysis conducted on geographies consisting of 148,874,934 people shows a mild negative correlation between the proportion of Afghans and per capita income in the United States with a correlation coefficient (R) of -0.302 and weighted average of $46,268. Similarly, the statistical analysis conducted on geographies consisting of 236,340,517 people shows a moderate negative correlation between the proportion of Immigrants from Nicaragua and per capita income in the United States with a correlation coefficient (R) of -0.441 and weighted average of $38,065, a difference of 21.5%.
Per Capita Income Correlation Summary
| Measurement | Afghan | Immigrants from Nicaragua |
| Minimum | $4,471 | $12,549 |
| Maximum | $78,942 | $55,632 |
| Range | $74,471 | $43,083 |
| Mean | $43,744 | $33,018 |
| Median | $43,810 | $33,470 |
| Interquartile 25% (IQ1) | $38,293 | $26,578 |
| Interquartile 75% (IQ3) | $50,059 | $39,762 |
| Interquartile Range (IQR) | $11,766 | $13,184 |
| Standard Deviation (Sample) | $13,009 | $9,366 |
| Standard Deviation (Population) | $12,919 | $9,309 |
Similar Demographics by Per Capita Income
Demographics Similar to Afghans by Per Capita Income
In terms of per capita income, the demographic groups most similar to Afghans are Immigrants from Chile ($46,213, a difference of 0.12%), Immigrants from Albania ($46,387, a difference of 0.26%), Polish ($46,123, a difference of 0.32%), Immigrants from Morocco ($46,430, a difference of 0.35%), and Chinese ($46,098, a difference of 0.37%).
| Demographics | Rating | Rank | Per Capita Income |
| Serbians | 96.2 /100 | #107 | Exceptional $46,551 |
| Immigrants | Kuwait | 96.2 /100 | #108 | Exceptional $46,543 |
| Immigrants | Northern Africa | 96.2 /100 | #109 | Exceptional $46,531 |
| Chileans | 95.9 /100 | #110 | Exceptional $46,459 |
| Taiwanese | 95.8 /100 | #111 | Exceptional $46,455 |
| Immigrants | Morocco | 95.7 /100 | #112 | Exceptional $46,430 |
| Immigrants | Albania | 95.5 /100 | #113 | Exceptional $46,387 |
| Afghans | 94.9 /100 | #114 | Exceptional $46,268 |
| Immigrants | Chile | 94.6 /100 | #115 | Exceptional $46,213 |
| Poles | 94.1 /100 | #116 | Exceptional $46,123 |
| Chinese | 93.9 /100 | #117 | Exceptional $46,098 |
| Immigrants | Saudi Arabia | 93.3 /100 | #118 | Exceptional $46,008 |
| Immigrants | Poland | 93.1 /100 | #119 | Exceptional $45,979 |
| Immigrants | Ethiopia | 92.7 /100 | #120 | Exceptional $45,923 |
| Canadians | 92.2 /100 | #121 | Exceptional $45,858 |
Demographics Similar to Immigrants from Nicaragua by Per Capita Income
In terms of per capita income, the demographic groups most similar to Immigrants from Nicaragua are Colville ($38,047, a difference of 0.050%), Potawatomi ($38,046, a difference of 0.050%), Comanche ($38,088, a difference of 0.060%), Hmong ($38,120, a difference of 0.15%), and Immigrants from Liberia ($38,165, a difference of 0.26%).
| Demographics | Rating | Rank | Per Capita Income |
| Central Americans | 0.3 /100 | #271 | Tragic $38,560 |
| Immigrants | Cabo Verde | 0.3 /100 | #272 | Tragic $38,540 |
| Nepalese | 0.3 /100 | #273 | Tragic $38,442 |
| Immigrants | El Salvador | 0.3 /100 | #274 | Tragic $38,394 |
| Immigrants | Liberia | 0.2 /100 | #275 | Tragic $38,165 |
| Hmong | 0.2 /100 | #276 | Tragic $38,120 |
| Comanche | 0.2 /100 | #277 | Tragic $38,088 |
| Immigrants | Nicaragua | 0.2 /100 | #278 | Tragic $38,065 |
| Colville | 0.2 /100 | #279 | Tragic $38,047 |
| Potawatomi | 0.2 /100 | #280 | Tragic $38,046 |
| Immigrants | Dominica | 0.2 /100 | #281 | Tragic $37,952 |
| Immigrants | Laos | 0.1 /100 | #282 | Tragic $37,857 |
| Pennsylvania Germans | 0.1 /100 | #283 | Tragic $37,842 |
| Africans | 0.1 /100 | #284 | Tragic $37,785 |
| Guatemalans | 0.1 /100 | #285 | Tragic $37,766 |