Yuman vs Paiute Median Family Income
COMPARE
Yuman
Paiute
Median Family Income
Median Family Income Comparison
Yuman
Paiute
$78,055
MEDIAN FAMILY INCOME
0.0/ 100
METRIC RATING
337th/ 347
METRIC RANK
$85,414
MEDIAN FAMILY INCOME
0.0/ 100
METRIC RATING
305th/ 347
METRIC RANK
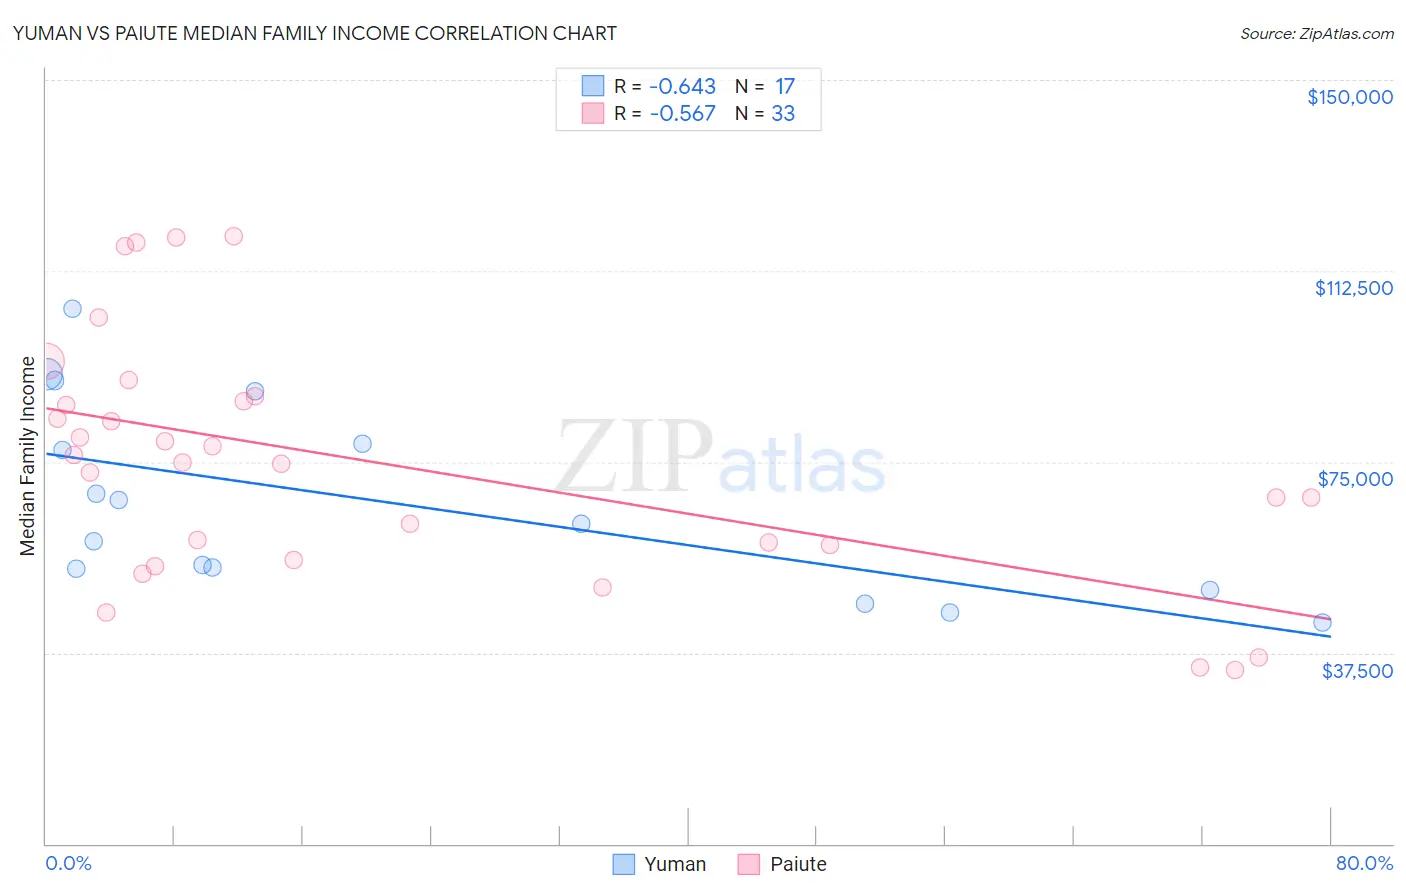
Yuman vs Paiute Median Family Income Correlation Chart
The statistical analysis conducted on geographies consisting of 40,661,885 people shows a significant negative correlation between the proportion of Yuman and median family income in the United States with a correlation coefficient (R) of -0.643 and weighted average of $78,055. Similarly, the statistical analysis conducted on geographies consisting of 58,388,516 people shows a substantial negative correlation between the proportion of Paiute and median family income in the United States with a correlation coefficient (R) of -0.567 and weighted average of $85,414, a difference of 9.4%.
Median Family Income Correlation Summary
| Measurement | Yuman | Paiute |
| Minimum | $43,500 | $34,107 |
| Maximum | $104,959 | $119,375 |
| Range | $61,459 | $85,268 |
| Mean | $67,052 | $74,748 |
| Median | $62,813 | $74,830 |
| Interquartile 25% (IQ1) | $51,959 | $57,230 |
| Interquartile 75% (IQ3) | $83,716 | $87,390 |
| Interquartile Range (IQR) | $31,757 | $30,160 |
| Standard Deviation (Sample) | $18,787 | $23,830 |
| Standard Deviation (Population) | $18,226 | $23,466 |
Similar Demographics by Median Family Income
Demographics Similar to Yuman by Median Family Income
In terms of median family income, the demographic groups most similar to Yuman are Immigrants from Cuba ($78,249, a difference of 0.25%), Immigrants from Yemen ($77,457, a difference of 0.77%), Pima ($77,431, a difference of 0.80%), Hopi ($77,188, a difference of 1.1%), and Pueblo ($76,880, a difference of 1.5%).
| Demographics | Rating | Rank | Median Family Income |
| Cheyenne | 0.0 /100 | #330 | Tragic $81,385 |
| Immigrants | Dominican Republic | 0.0 /100 | #331 | Tragic $81,233 |
| Natives/Alaskans | 0.0 /100 | #332 | Tragic $80,908 |
| Kiowa | 0.0 /100 | #333 | Tragic $80,885 |
| Menominee | 0.0 /100 | #334 | Tragic $79,563 |
| Yup'ik | 0.0 /100 | #335 | Tragic $79,290 |
| Immigrants | Cuba | 0.0 /100 | #336 | Tragic $78,249 |
| Yuman | 0.0 /100 | #337 | Tragic $78,055 |
| Immigrants | Yemen | 0.0 /100 | #338 | Tragic $77,457 |
| Pima | 0.0 /100 | #339 | Tragic $77,431 |
| Hopi | 0.0 /100 | #340 | Tragic $77,188 |
| Pueblo | 0.0 /100 | #341 | Tragic $76,880 |
| Crow | 0.0 /100 | #342 | Tragic $76,605 |
| Houma | 0.0 /100 | #343 | Tragic $76,188 |
| Tohono O'odham | 0.0 /100 | #344 | Tragic $72,193 |
Demographics Similar to Paiute by Median Family Income
In terms of median family income, the demographic groups most similar to Paiute are Immigrants from Dominica ($85,411, a difference of 0.0%), Chickasaw ($85,356, a difference of 0.070%), U.S. Virgin Islander ($85,294, a difference of 0.14%), Haitian ($85,218, a difference of 0.23%), and Mexican ($85,618, a difference of 0.24%).
| Demographics | Rating | Rank | Median Family Income |
| Immigrants | Latin America | 0.0 /100 | #298 | Tragic $86,989 |
| Chippewa | 0.0 /100 | #299 | Tragic $86,852 |
| Ottawa | 0.0 /100 | #300 | Tragic $86,380 |
| Colville | 0.0 /100 | #301 | Tragic $85,792 |
| Spanish American Indians | 0.0 /100 | #302 | Tragic $85,728 |
| Hispanics or Latinos | 0.0 /100 | #303 | Tragic $85,647 |
| Mexicans | 0.0 /100 | #304 | Tragic $85,618 |
| Paiute | 0.0 /100 | #305 | Tragic $85,414 |
| Immigrants | Dominica | 0.0 /100 | #306 | Tragic $85,411 |
| Chickasaw | 0.0 /100 | #307 | Tragic $85,356 |
| U.S. Virgin Islanders | 0.0 /100 | #308 | Tragic $85,294 |
| Haitians | 0.0 /100 | #309 | Tragic $85,218 |
| Immigrants | Central America | 0.0 /100 | #310 | Tragic $85,050 |
| Hondurans | 0.0 /100 | #311 | Tragic $85,004 |
| Cubans | 0.0 /100 | #312 | Tragic $84,981 |