Slavic vs Ugandan Householder Income Under 25 years
COMPARE
Slavic
Ugandan
Householder Income Under 25 years
Householder Income Under 25 years Comparison
Slavs
Ugandans
$50,563
HOUSEHOLDER INCOME UNDER 25 YEARS
1.8/ 100
METRIC RATING
248th/ 347
METRIC RANK
$50,923
HOUSEHOLDER INCOME UNDER 25 YEARS
4.3/ 100
METRIC RATING
231st/ 347
METRIC RANK
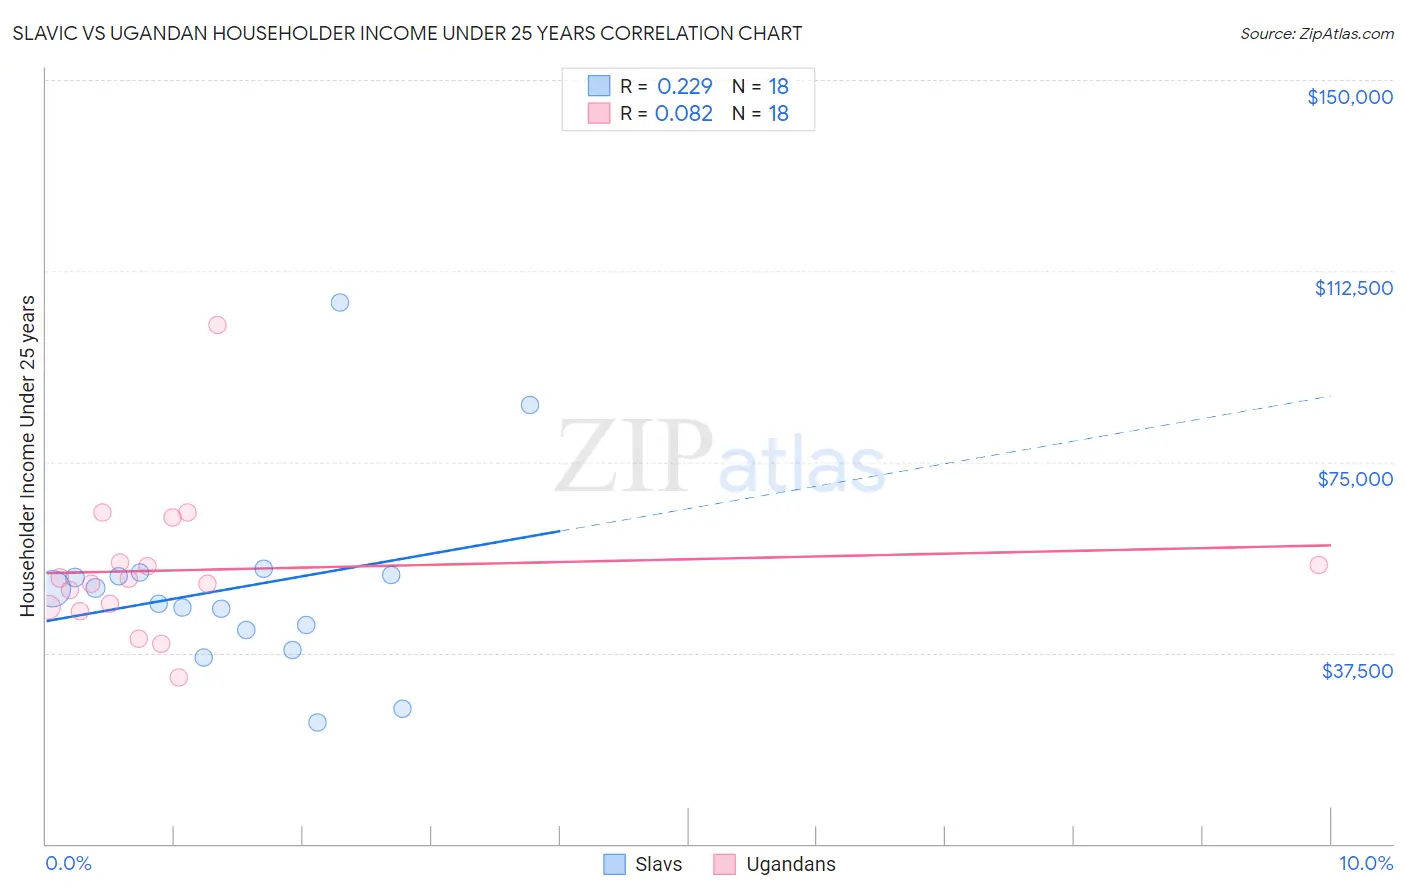
Slavic vs Ugandan Householder Income Under 25 years Correlation Chart
The statistical analysis conducted on geographies consisting of 235,100,045 people shows a weak positive correlation between the proportion of Slavs and household income with householder under the age of 25 in the United States with a correlation coefficient (R) of 0.229 and weighted average of $50,563. Similarly, the statistical analysis conducted on geographies consisting of 89,521,491 people shows a slight positive correlation between the proportion of Ugandans and household income with householder under the age of 25 in the United States with a correlation coefficient (R) of 0.082 and weighted average of $50,923, a difference of 0.71%.
Householder Income Under 25 years Correlation Summary
| Measurement | Slavic | Ugandan |
| Minimum | $23,750 | $32,682 |
| Maximum | $106,250 | $101,868 |
| Range | $82,500 | $69,186 |
| Mean | $50,421 | $53,778 |
| Median | $48,652 | $51,561 |
| Interquartile 25% (IQ1) | $41,986 | $46,457 |
| Interquartile 75% (IQ3) | $52,857 | $55,330 |
| Interquartile Range (IQR) | $10,871 | $8,874 |
| Standard Deviation (Sample) | $19,147 | $14,802 |
| Standard Deviation (Population) | $18,607 | $14,385 |
Demographics Similar to Slavs and Ugandans by Householder Income Under 25 years
In terms of householder income under 25 years, the demographic groups most similar to Slavs are Immigrants from Bosnia and Herzegovina ($50,565, a difference of 0.0%), Scottish ($50,554, a difference of 0.020%), Welsh ($50,597, a difference of 0.070%), Immigrants from Africa ($50,609, a difference of 0.090%), and Marshallese ($50,627, a difference of 0.13%). Similarly, the demographic groups most similar to Ugandans are Jamaican ($50,929, a difference of 0.010%), Yuman ($50,933, a difference of 0.020%), Slovene ($50,886, a difference of 0.070%), Pennsylvania German ($50,852, a difference of 0.14%), and Kenyan ($50,815, a difference of 0.21%).
| Demographics | Rating | Rank | Householder Income Under 25 years |
| Yuman | 4.4 /100 | #229 | Tragic $50,933 |
| Jamaicans | 4.4 /100 | #230 | Tragic $50,929 |
| Ugandans | 4.3 /100 | #231 | Tragic $50,923 |
| Slovenes | 4.0 /100 | #232 | Tragic $50,886 |
| Pennsylvania Germans | 3.7 /100 | #233 | Tragic $50,852 |
| Kenyans | 3.3 /100 | #234 | Tragic $50,815 |
| Spanish | 3.3 /100 | #235 | Tragic $50,813 |
| English | 3.3 /100 | #236 | Tragic $50,805 |
| Germans | 3.3 /100 | #237 | Tragic $50,804 |
| Iraqis | 3.2 /100 | #238 | Tragic $50,802 |
| Immigrants | Caribbean | 2.9 /100 | #239 | Tragic $50,757 |
| Immigrants | Lebanon | 2.7 /100 | #240 | Tragic $50,729 |
| Immigrants | Micronesia | 2.5 /100 | #241 | Tragic $50,691 |
| Cubans | 2.3 /100 | #242 | Tragic $50,655 |
| Immigrants | Thailand | 2.2 /100 | #243 | Tragic $50,645 |
| Marshallese | 2.1 /100 | #244 | Tragic $50,627 |
| Immigrants | Africa | 2.0 /100 | #245 | Tragic $50,609 |
| Welsh | 2.0 /100 | #246 | Tragic $50,597 |
| Immigrants | Bosnia and Herzegovina | 1.8 /100 | #247 | Tragic $50,565 |
| Slavs | 1.8 /100 | #248 | Tragic $50,563 |
| Scottish | 1.8 /100 | #249 | Tragic $50,554 |