Immigrants from Hong Kong vs Immigrants from Poland Householder Income Ages 45 - 64 years
COMPARE
Immigrants from Hong Kong
Immigrants from Poland
Householder Income Ages 45 - 64 years
Householder Income Ages 45 - 64 years Comparison
Immigrants from Hong Kong
Immigrants from Poland
$127,500
HOUSEHOLDER INCOME AGES 45 - 64 YEARS
100.0/ 100
METRIC RATING
7th/ 347
METRIC RANK
$106,319
HOUSEHOLDER INCOME AGES 45 - 64 YEARS
95.3/ 100
METRIC RATING
114th/ 347
METRIC RANK
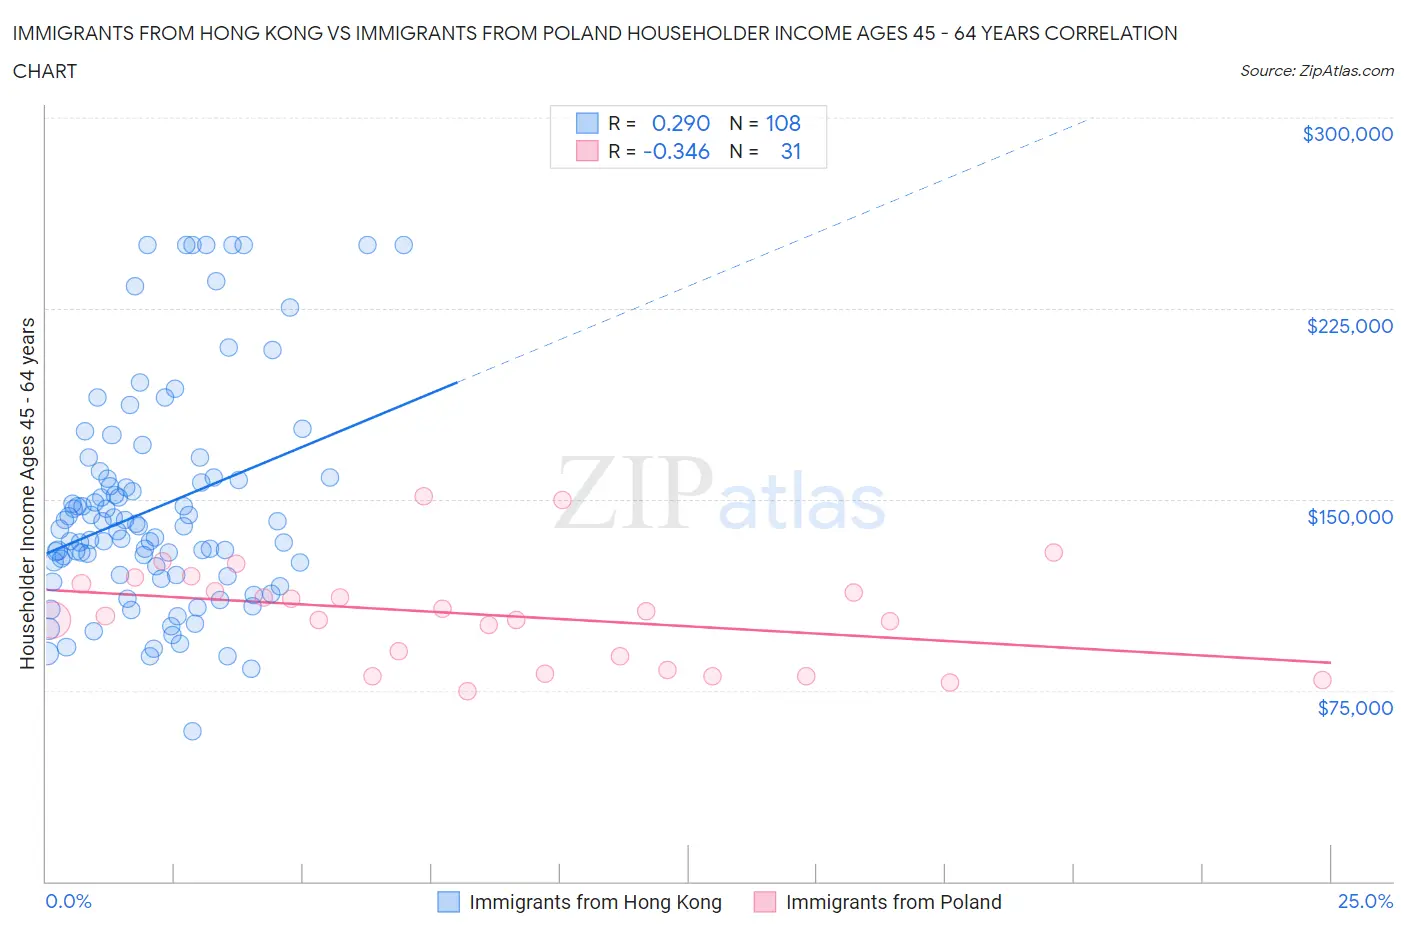
Immigrants from Hong Kong vs Immigrants from Poland Householder Income Ages 45 - 64 years Correlation Chart
The statistical analysis conducted on geographies consisting of 253,785,211 people shows a weak positive correlation between the proportion of Immigrants from Hong Kong and household income with householder between the ages 45 and 64 in the United States with a correlation coefficient (R) of 0.290 and weighted average of $127,500. Similarly, the statistical analysis conducted on geographies consisting of 304,578,268 people shows a mild negative correlation between the proportion of Immigrants from Poland and household income with householder between the ages 45 and 64 in the United States with a correlation coefficient (R) of -0.346 and weighted average of $106,319, a difference of 19.9%.
Householder Income Ages 45 - 64 years Correlation Summary
| Measurement | Immigrants from Hong Kong | Immigrants from Poland |
| Minimum | $59,041 | $74,827 |
| Maximum | $250,001 | $151,262 |
| Range | $190,960 | $76,436 |
| Mean | $146,614 | $104,596 |
| Median | $138,796 | $104,115 |
| Interquartile 25% (IQ1) | $120,380 | $82,959 |
| Interquartile 75% (IQ3) | $158,248 | $116,688 |
| Interquartile Range (IQR) | $37,867 | $33,729 |
| Standard Deviation (Sample) | $42,909 | $20,034 |
| Standard Deviation (Population) | $42,710 | $19,708 |
Similar Demographics by Householder Income Ages 45 - 64 years
Demographics Similar to Immigrants from Hong Kong by Householder Income Ages 45 - 64 years
In terms of householder income ages 45 - 64 years, the demographic groups most similar to Immigrants from Hong Kong are Immigrants from Iran ($126,940, a difference of 0.44%), Iranian ($129,350, a difference of 1.5%), Immigrants from Singapore ($129,514, a difference of 1.6%), Thai ($129,560, a difference of 1.6%), and Okinawan ($124,796, a difference of 2.2%).
| Demographics | Rating | Rank | Householder Income Ages 45 - 64 years |
| Immigrants | Taiwan | 100.0 /100 | #1 | Exceptional $135,508 |
| Filipinos | 100.0 /100 | #2 | Exceptional $134,910 |
| Immigrants | India | 100.0 /100 | #3 | Exceptional $132,488 |
| Thais | 100.0 /100 | #4 | Exceptional $129,560 |
| Immigrants | Singapore | 100.0 /100 | #5 | Exceptional $129,514 |
| Iranians | 100.0 /100 | #6 | Exceptional $129,350 |
| Immigrants | Hong Kong | 100.0 /100 | #7 | Exceptional $127,500 |
| Immigrants | Iran | 100.0 /100 | #8 | Exceptional $126,940 |
| Okinawans | 100.0 /100 | #9 | Exceptional $124,796 |
| Immigrants | South Central Asia | 100.0 /100 | #10 | Exceptional $124,188 |
| Cypriots | 100.0 /100 | #11 | Exceptional $123,396 |
| Immigrants | Israel | 100.0 /100 | #12 | Exceptional $122,893 |
| Immigrants | Ireland | 100.0 /100 | #13 | Exceptional $122,757 |
| Indians (Asian) | 100.0 /100 | #14 | Exceptional $122,343 |
| Immigrants | Eastern Asia | 100.0 /100 | #15 | Exceptional $122,222 |
Demographics Similar to Immigrants from Poland by Householder Income Ages 45 - 64 years
In terms of householder income ages 45 - 64 years, the demographic groups most similar to Immigrants from Poland are Immigrants from Kuwait ($106,285, a difference of 0.030%), European ($106,367, a difference of 0.050%), British ($106,264, a difference of 0.050%), Swedish ($106,377, a difference of 0.060%), and Albanian ($106,243, a difference of 0.070%).
| Demographics | Rating | Rank | Householder Income Ages 45 - 64 years |
| Immigrants | Fiji | 96.5 /100 | #107 | Exceptional $106,952 |
| Zimbabweans | 96.3 /100 | #108 | Exceptional $106,849 |
| Chileans | 95.9 /100 | #109 | Exceptional $106,611 |
| Immigrants | Brazil | 95.6 /100 | #110 | Exceptional $106,470 |
| Immigrants | Vietnam | 95.5 /100 | #111 | Exceptional $106,417 |
| Swedes | 95.4 /100 | #112 | Exceptional $106,377 |
| Europeans | 95.4 /100 | #113 | Exceptional $106,367 |
| Immigrants | Poland | 95.3 /100 | #114 | Exceptional $106,319 |
| Immigrants | Kuwait | 95.2 /100 | #115 | Exceptional $106,285 |
| British | 95.2 /100 | #116 | Exceptional $106,264 |
| Albanians | 95.1 /100 | #117 | Exceptional $106,243 |
| Immigrants | Western Asia | 95.0 /100 | #118 | Exceptional $106,217 |
| Immigrants | Jordan | 94.9 /100 | #119 | Exceptional $106,164 |
| Immigrants | South Eastern Asia | 94.8 /100 | #120 | Exceptional $106,109 |
| Poles | 94.4 /100 | #121 | Exceptional $105,952 |