Yugoslavian vs Pima 10th Grade
COMPARE
Yugoslavian
Pima
10th Grade
10th Grade Comparison
Yugoslavians
Pima
94.6%
10TH GRADE
98.4/ 100
METRIC RATING
92nd/ 347
METRIC RANK
91.2%
10TH GRADE
0.0/ 100
METRIC RATING
304th/ 347
METRIC RANK
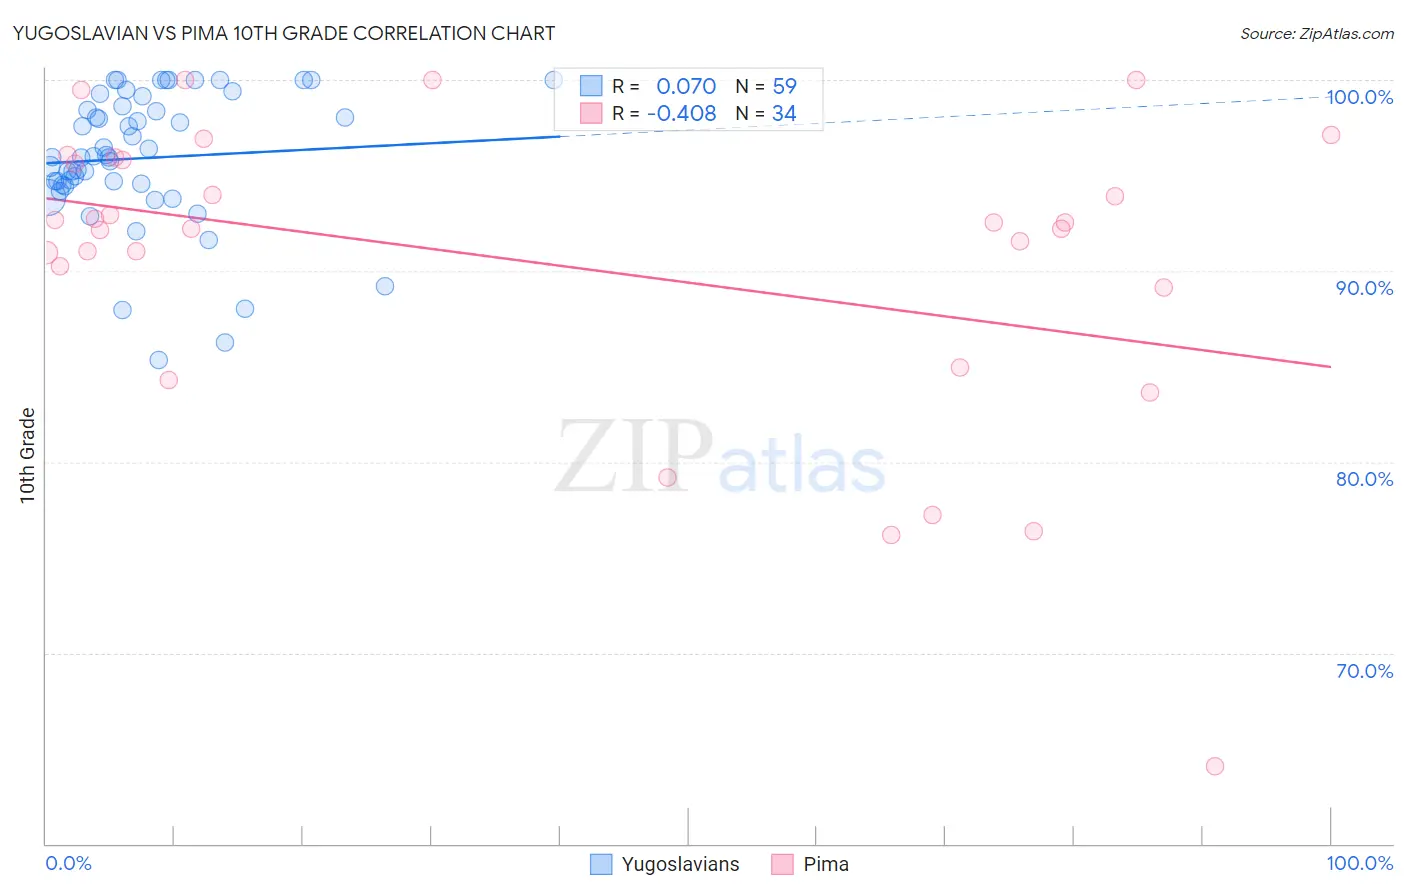
Yugoslavian vs Pima 10th Grade Correlation Chart
The statistical analysis conducted on geographies consisting of 285,719,638 people shows a slight positive correlation between the proportion of Yugoslavians and percentage of population with at least 10th grade education in the United States with a correlation coefficient (R) of 0.070 and weighted average of 94.6%. Similarly, the statistical analysis conducted on geographies consisting of 61,552,942 people shows a moderate negative correlation between the proportion of Pima and percentage of population with at least 10th grade education in the United States with a correlation coefficient (R) of -0.408 and weighted average of 91.2%, a difference of 3.8%.
10th Grade Correlation Summary
| Measurement | Yugoslavian | Pima |
| Minimum | 85.3% | 64.0% |
| Maximum | 100.0% | 100.0% |
| Range | 14.7% | 36.0% |
| Mean | 95.9% | 90.4% |
| Median | 95.9% | 92.4% |
| Interquartile 25% (IQ1) | 94.5% | 89.1% |
| Interquartile 75% (IQ3) | 98.7% | 95.8% |
| Interquartile Range (IQR) | 4.1% | 6.7% |
| Standard Deviation (Sample) | 3.5% | 8.0% |
| Standard Deviation (Population) | 3.5% | 7.9% |
Similar Demographics by 10th Grade
Demographics Similar to Yugoslavians by 10th Grade
In terms of 10th grade, the demographic groups most similar to Yugoslavians are Soviet Union (94.6%, a difference of 0.010%), Immigrants from Germany (94.6%, a difference of 0.010%), Menominee (94.6%, a difference of 0.010%), Immigrants from Switzerland (94.6%, a difference of 0.020%), and Lebanese (94.6%, a difference of 0.020%).
| Demographics | Rating | Rank | 10th Grade |
| Crow | 99.0 /100 | #85 | Exceptional 94.7% |
| Puget Sound Salish | 99.0 /100 | #86 | Exceptional 94.7% |
| Immigrants | Saudi Arabia | 99.0 /100 | #87 | Exceptional 94.7% |
| Immigrants | Japan | 99.0 /100 | #88 | Exceptional 94.7% |
| Immigrants | Moldova | 98.9 /100 | #89 | Exceptional 94.7% |
| South Africans | 98.8 /100 | #90 | Exceptional 94.7% |
| Whites/Caucasians | 98.8 /100 | #91 | Exceptional 94.7% |
| Yugoslavians | 98.4 /100 | #92 | Exceptional 94.6% |
| Soviet Union | 98.3 /100 | #93 | Exceptional 94.6% |
| Immigrants | Germany | 98.3 /100 | #94 | Exceptional 94.6% |
| Menominee | 98.3 /100 | #95 | Exceptional 94.6% |
| Immigrants | Switzerland | 98.3 /100 | #96 | Exceptional 94.6% |
| Lebanese | 98.3 /100 | #97 | Exceptional 94.6% |
| Immigrants | Bulgaria | 98.1 /100 | #98 | Exceptional 94.6% |
| Immigrants | France | 97.9 /100 | #99 | Exceptional 94.5% |
Demographics Similar to Pima by 10th Grade
In terms of 10th grade, the demographic groups most similar to Pima are Immigrants from Dominica (91.1%, a difference of 0.020%), Immigrants from Vietnam (91.2%, a difference of 0.060%), Japanese (91.2%, a difference of 0.080%), Immigrants from Guyana (91.2%, a difference of 0.080%), and Yaqui (91.1%, a difference of 0.080%).
| Demographics | Rating | Rank | 10th Grade |
| Fijians | 0.0 /100 | #297 | Tragic 91.5% |
| Cubans | 0.0 /100 | #298 | Tragic 91.5% |
| Immigrants | Haiti | 0.0 /100 | #299 | Tragic 91.4% |
| Guyanese | 0.0 /100 | #300 | Tragic 91.4% |
| Japanese | 0.0 /100 | #301 | Tragic 91.2% |
| Immigrants | Guyana | 0.0 /100 | #302 | Tragic 91.2% |
| Immigrants | Vietnam | 0.0 /100 | #303 | Tragic 91.2% |
| Pima | 0.0 /100 | #304 | Tragic 91.2% |
| Immigrants | Dominica | 0.0 /100 | #305 | Tragic 91.1% |
| Yaqui | 0.0 /100 | #306 | Tragic 91.1% |
| Immigrants | Fiji | 0.0 /100 | #307 | Tragic 91.0% |
| Immigrants | Bangladesh | 0.0 /100 | #308 | Tragic 91.0% |
| Immigrants | Immigrants | 0.0 /100 | #309 | Tragic 91.0% |
| Vietnamese | 0.0 /100 | #310 | Tragic 90.9% |
| Immigrants | Cambodia | 0.0 /100 | #311 | Tragic 90.9% |