Yugoslavian vs Barbadian Householder Income Ages 25 - 44 years
COMPARE
Yugoslavian
Barbadian
Householder Income Ages 25 - 44 years
Householder Income Ages 25 - 44 years Comparison
Yugoslavians
Barbadians
$91,368
HOUSEHOLDER INCOME AGES 25 - 44 YEARS
14.5/ 100
METRIC RATING
207th/ 347
METRIC RANK
$89,565
HOUSEHOLDER INCOME AGES 25 - 44 YEARS
5.9/ 100
METRIC RATING
224th/ 347
METRIC RANK
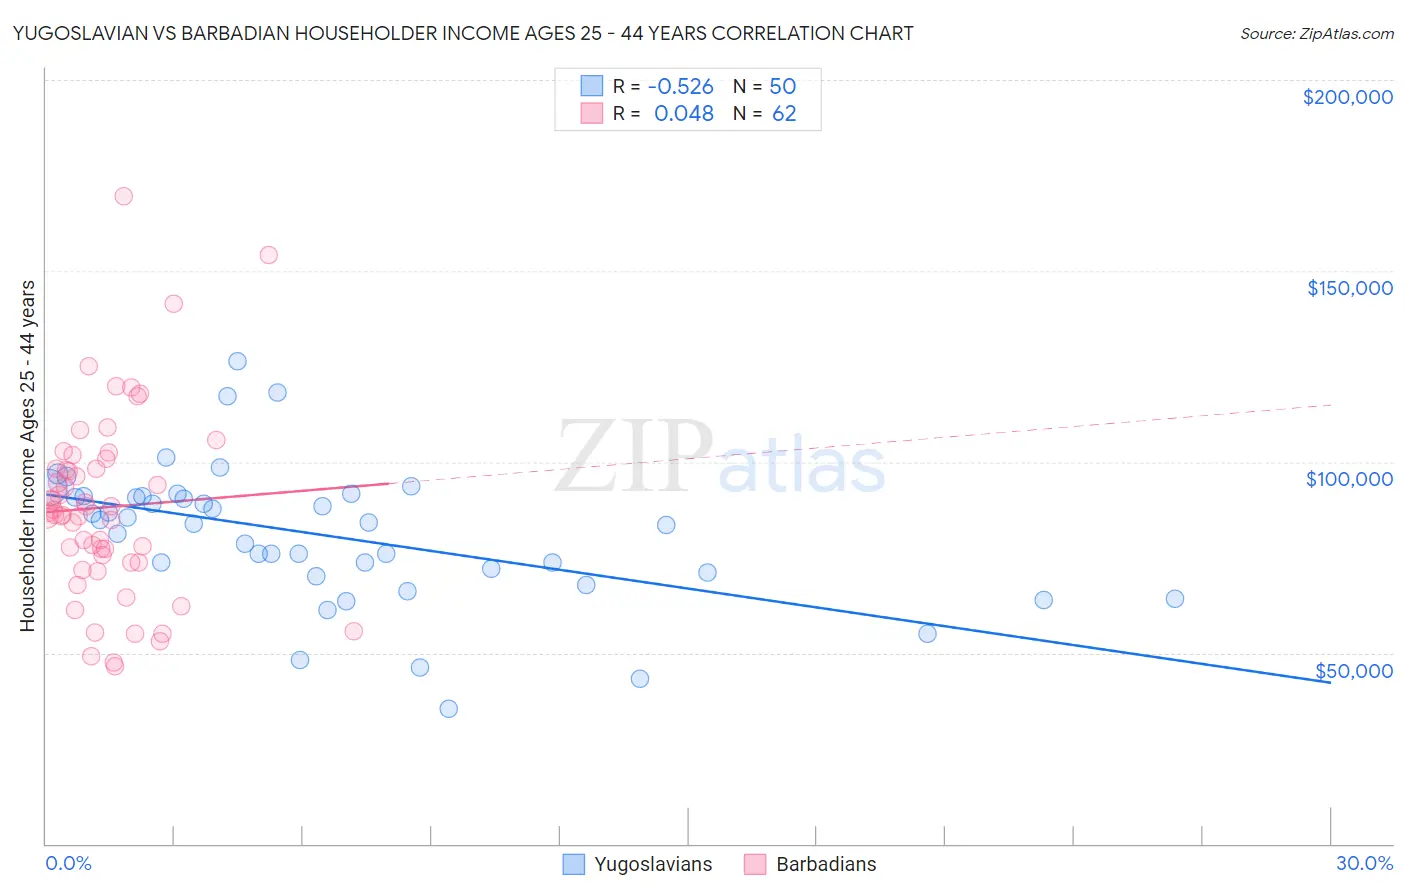
Yugoslavian vs Barbadian Householder Income Ages 25 - 44 years Correlation Chart
The statistical analysis conducted on geographies consisting of 285,145,495 people shows a substantial negative correlation between the proportion of Yugoslavians and household income with householder between the ages 25 and 44 in the United States with a correlation coefficient (R) of -0.526 and weighted average of $91,368. Similarly, the statistical analysis conducted on geographies consisting of 141,212,757 people shows no correlation between the proportion of Barbadians and household income with householder between the ages 25 and 44 in the United States with a correlation coefficient (R) of 0.048 and weighted average of $89,565, a difference of 2.0%.
Householder Income Ages 25 - 44 years Correlation Summary
| Measurement | Yugoslavian | Barbadian |
| Minimum | $35,313 | $46,484 |
| Maximum | $126,461 | $169,656 |
| Range | $91,148 | $123,172 |
| Mean | $80,797 | $88,113 |
| Median | $83,915 | $86,577 |
| Interquartile 25% (IQ1) | $71,042 | $73,781 |
| Interquartile 75% (IQ3) | $90,884 | $98,316 |
| Interquartile Range (IQR) | $19,842 | $24,535 |
| Standard Deviation (Sample) | $18,085 | $24,335 |
| Standard Deviation (Population) | $17,903 | $24,138 |
Demographics Similar to Yugoslavians and Barbadians by Householder Income Ages 25 - 44 years
In terms of householder income ages 25 - 44 years, the demographic groups most similar to Yugoslavians are Aleut ($91,370, a difference of 0.0%), Immigrants from Thailand ($91,337, a difference of 0.030%), Immigrants from Eastern Africa ($91,458, a difference of 0.10%), Immigrants from Uruguay ($91,171, a difference of 0.22%), and Immigrants from Kenya ($90,767, a difference of 0.66%). Similarly, the demographic groups most similar to Barbadians are Immigrants from Guyana ($89,586, a difference of 0.020%), Immigrants from Ecuador ($89,673, a difference of 0.12%), Immigrants from Panama ($89,451, a difference of 0.13%), Immigrants from Trinidad and Tobago ($89,748, a difference of 0.20%), and Trinidadian and Tobagonian ($89,856, a difference of 0.33%).
| Demographics | Rating | Rank | Householder Income Ages 25 - 44 years |
| Immigrants | Eastern Africa | 15.2 /100 | #205 | Poor $91,458 |
| Aleuts | 14.5 /100 | #206 | Poor $91,370 |
| Yugoslavians | 14.5 /100 | #207 | Poor $91,368 |
| Immigrants | Thailand | 14.3 /100 | #208 | Poor $91,337 |
| Immigrants | Uruguay | 13.2 /100 | #209 | Poor $91,171 |
| Immigrants | Kenya | 10.9 /100 | #210 | Poor $90,767 |
| Iraqis | 10.8 /100 | #211 | Poor $90,764 |
| Hawaiians | 10.6 /100 | #212 | Poor $90,722 |
| Immigrants | Bangladesh | 9.3 /100 | #213 | Tragic $90,448 |
| Immigrants | Africa | 8.9 /100 | #214 | Tragic $90,372 |
| Panamanians | 8.1 /100 | #215 | Tragic $90,193 |
| Ghanaians | 7.9 /100 | #216 | Tragic $90,137 |
| Scotch-Irish | 7.3 /100 | #217 | Tragic $89,969 |
| Guyanese | 7.1 /100 | #218 | Tragic $89,940 |
| Delaware | 6.9 /100 | #219 | Tragic $89,876 |
| Trinidadians and Tobagonians | 6.8 /100 | #220 | Tragic $89,856 |
| Immigrants | Trinidad and Tobago | 6.5 /100 | #221 | Tragic $89,748 |
| Immigrants | Ecuador | 6.2 /100 | #222 | Tragic $89,673 |
| Immigrants | Guyana | 5.9 /100 | #223 | Tragic $89,586 |
| Barbadians | 5.9 /100 | #224 | Tragic $89,565 |
| Immigrants | Panama | 5.5 /100 | #225 | Tragic $89,451 |