Immigrants from Micronesia vs Immigrants from Germany Median Family Income
COMPARE
Immigrants from Micronesia
Immigrants from Germany
Median Family Income
Median Family Income Comparison
Immigrants from Micronesia
Immigrants from Germany
$90,345
MEDIAN FAMILY INCOME
0.2/ 100
METRIC RATING
273rd/ 347
METRIC RANK
$105,507
MEDIAN FAMILY INCOME
80.9/ 100
METRIC RATING
149th/ 347
METRIC RANK
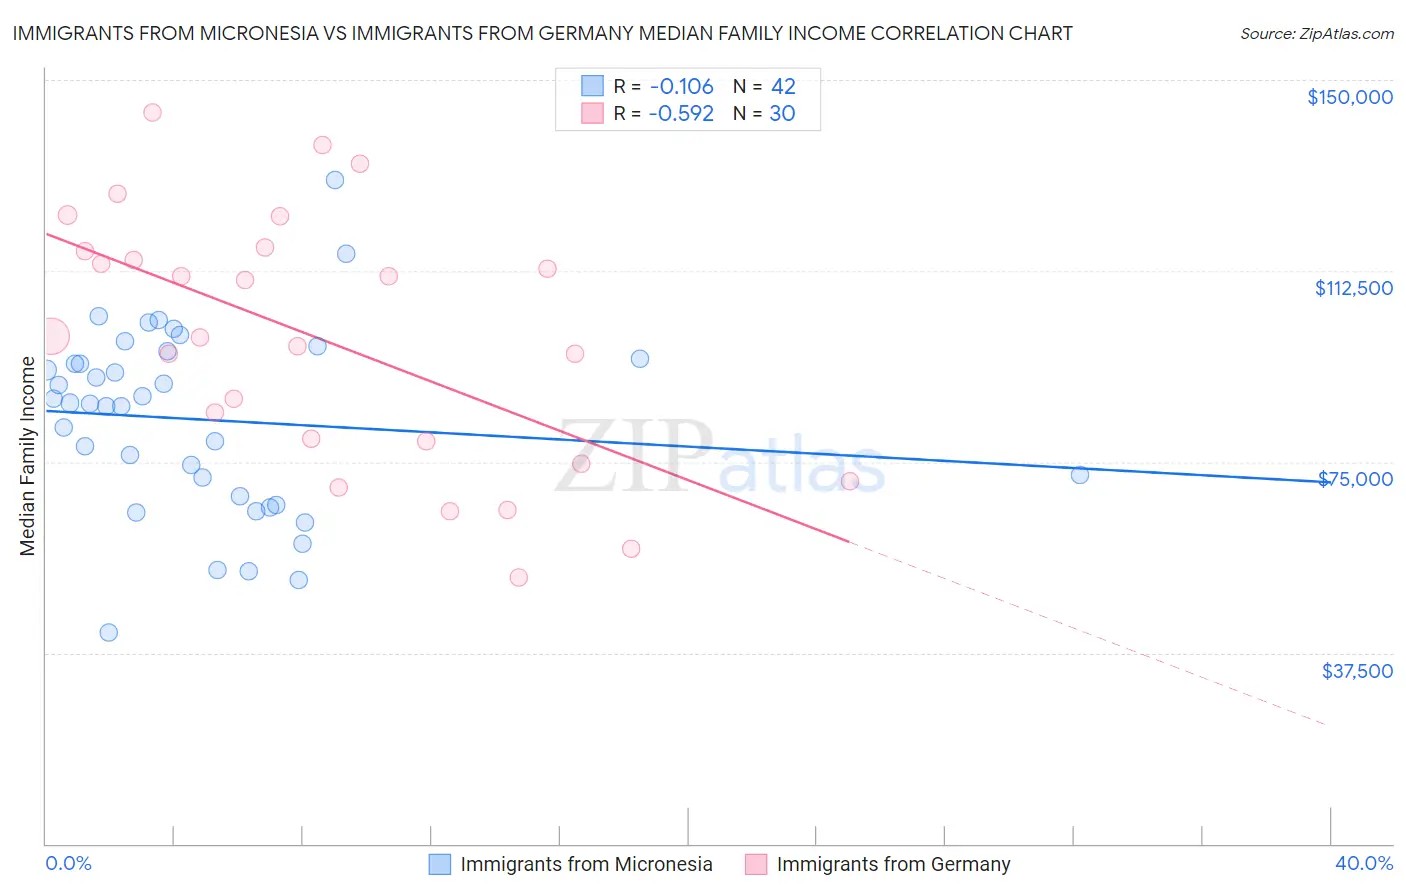
Immigrants from Micronesia vs Immigrants from Germany Median Family Income Correlation Chart
The statistical analysis conducted on geographies consisting of 61,597,595 people shows a poor negative correlation between the proportion of Immigrants from Micronesia and median family income in the United States with a correlation coefficient (R) of -0.106 and weighted average of $90,345. Similarly, the statistical analysis conducted on geographies consisting of 463,646,337 people shows a substantial negative correlation between the proportion of Immigrants from Germany and median family income in the United States with a correlation coefficient (R) of -0.592 and weighted average of $105,507, a difference of 16.8%.
Median Family Income Correlation Summary
| Measurement | Immigrants from Micronesia | Immigrants from Germany |
| Minimum | $41,563 | $52,386 |
| Maximum | $130,417 | $143,516 |
| Range | $88,854 | $91,130 |
| Mean | $83,297 | $99,149 |
| Median | $86,500 | $99,484 |
| Interquartile 25% (IQ1) | $68,241 | $79,167 |
| Interquartile 75% (IQ3) | $95,313 | $116,480 |
| Interquartile Range (IQR) | $27,072 | $37,313 |
| Standard Deviation (Sample) | $18,370 | $24,798 |
| Standard Deviation (Population) | $18,150 | $24,381 |
Similar Demographics by Median Family Income
Demographics Similar to Immigrants from Micronesia by Median Family Income
In terms of median family income, the demographic groups most similar to Immigrants from Micronesia are Spanish American ($90,322, a difference of 0.020%), Immigrants from Liberia ($90,450, a difference of 0.12%), Iroquois ($90,543, a difference of 0.22%), Jamaican ($90,581, a difference of 0.26%), and Immigrants from St. Vincent and the Grenadines ($90,094, a difference of 0.28%).
| Demographics | Rating | Rank | Median Family Income |
| Central Americans | 0.3 /100 | #266 | Tragic $91,087 |
| Mexican American Indians | 0.2 /100 | #267 | Tragic $90,918 |
| Cree | 0.2 /100 | #268 | Tragic $90,882 |
| Belizeans | 0.2 /100 | #269 | Tragic $90,880 |
| Jamaicans | 0.2 /100 | #270 | Tragic $90,581 |
| Iroquois | 0.2 /100 | #271 | Tragic $90,543 |
| Immigrants | Liberia | 0.2 /100 | #272 | Tragic $90,450 |
| Immigrants | Micronesia | 0.2 /100 | #273 | Tragic $90,345 |
| Spanish Americans | 0.2 /100 | #274 | Tragic $90,322 |
| Immigrants | St. Vincent and the Grenadines | 0.2 /100 | #275 | Tragic $90,094 |
| Immigrants | Zaire | 0.1 /100 | #276 | Tragic $89,285 |
| Immigrants | Jamaica | 0.1 /100 | #277 | Tragic $89,268 |
| Immigrants | Grenada | 0.1 /100 | #278 | Tragic $89,249 |
| Immigrants | Belize | 0.1 /100 | #279 | Tragic $89,197 |
| British West Indians | 0.1 /100 | #280 | Tragic $88,987 |
Demographics Similar to Immigrants from Germany by Median Family Income
In terms of median family income, the demographic groups most similar to Immigrants from Germany are Irish ($105,453, a difference of 0.050%), Peruvian ($105,444, a difference of 0.060%), Hungarian ($105,609, a difference of 0.10%), Immigrants from Chile ($105,655, a difference of 0.14%), and Immigrants from Albania ($105,285, a difference of 0.21%).
| Demographics | Rating | Rank | Median Family Income |
| Slovenes | 84.7 /100 | #142 | Excellent $106,020 |
| Tongans | 84.3 /100 | #143 | Excellent $105,967 |
| Immigrants | Morocco | 84.3 /100 | #144 | Excellent $105,964 |
| Danes | 83.8 /100 | #145 | Excellent $105,900 |
| Czechs | 83.4 /100 | #146 | Excellent $105,839 |
| Immigrants | Chile | 82.1 /100 | #147 | Excellent $105,655 |
| Hungarians | 81.7 /100 | #148 | Excellent $105,609 |
| Immigrants | Germany | 80.9 /100 | #149 | Excellent $105,507 |
| Irish | 80.5 /100 | #150 | Excellent $105,453 |
| Peruvians | 80.4 /100 | #151 | Excellent $105,444 |
| Immigrants | Albania | 79.1 /100 | #152 | Good $105,285 |
| Slavs | 77.9 /100 | #153 | Good $105,144 |
| Immigrants | Nepal | 76.3 /100 | #154 | Good $104,966 |
| Native Hawaiians | 75.8 /100 | #155 | Good $104,910 |
| Basques | 74.4 /100 | #156 | Good $104,760 |