Yakama vs Ethiopian Median Family Income
COMPARE
Yakama
Ethiopian
Median Family Income
Median Family Income Comparison
Yakama
Ethiopians
$83,932
MEDIAN FAMILY INCOME
0.0/ 100
METRIC RATING
317th/ 347
METRIC RANK
$108,251
MEDIAN FAMILY INCOME
94.5/ 100
METRIC RATING
118th/ 347
METRIC RANK
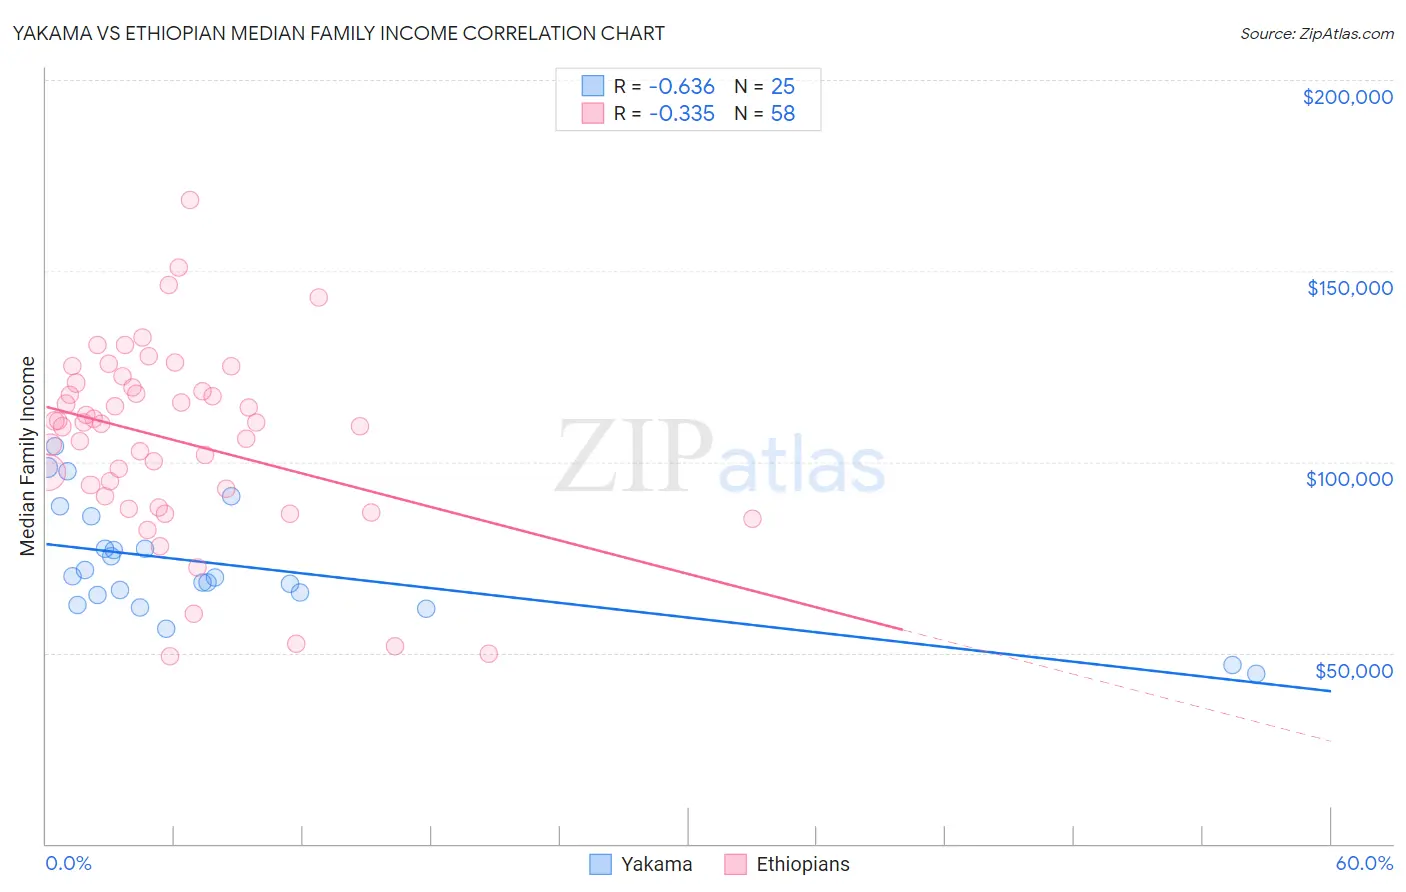
Yakama vs Ethiopian Median Family Income Correlation Chart
The statistical analysis conducted on geographies consisting of 19,915,987 people shows a significant negative correlation between the proportion of Yakama and median family income in the United States with a correlation coefficient (R) of -0.636 and weighted average of $83,932. Similarly, the statistical analysis conducted on geographies consisting of 223,032,575 people shows a mild negative correlation between the proportion of Ethiopians and median family income in the United States with a correlation coefficient (R) of -0.335 and weighted average of $108,251, a difference of 29.0%.
Median Family Income Correlation Summary
| Measurement | Yakama | Ethiopian |
| Minimum | $44,375 | $48,964 |
| Maximum | $103,973 | $168,594 |
| Range | $59,598 | $119,630 |
| Mean | $72,774 | $105,611 |
| Median | $69,699 | $110,185 |
| Interquartile 25% (IQ1) | $63,837 | $91,124 |
| Interquartile 75% (IQ3) | $81,474 | $119,625 |
| Interquartile Range (IQR) | $17,637 | $28,501 |
| Standard Deviation (Sample) | $14,936 | $24,590 |
| Standard Deviation (Population) | $14,634 | $24,377 |
Similar Demographics by Median Family Income
Demographics Similar to Yakama by Median Family Income
In terms of median family income, the demographic groups most similar to Yakama are Immigrants from Haiti ($84,018, a difference of 0.10%), Immigrants from Mexico ($83,639, a difference of 0.35%), Immigrants from Honduras ($83,618, a difference of 0.38%), Apache ($84,451, a difference of 0.62%), and Seminole ($83,354, a difference of 0.69%).
| Demographics | Rating | Rank | Median Family Income |
| Immigrants | Central America | 0.0 /100 | #310 | Tragic $85,050 |
| Hondurans | 0.0 /100 | #311 | Tragic $85,004 |
| Cubans | 0.0 /100 | #312 | Tragic $84,981 |
| Choctaw | 0.0 /100 | #313 | Tragic $84,835 |
| Immigrants | Bahamas | 0.0 /100 | #314 | Tragic $84,732 |
| Apache | 0.0 /100 | #315 | Tragic $84,451 |
| Immigrants | Haiti | 0.0 /100 | #316 | Tragic $84,018 |
| Yakama | 0.0 /100 | #317 | Tragic $83,932 |
| Immigrants | Mexico | 0.0 /100 | #318 | Tragic $83,639 |
| Immigrants | Honduras | 0.0 /100 | #319 | Tragic $83,618 |
| Seminole | 0.0 /100 | #320 | Tragic $83,354 |
| Immigrants | Caribbean | 0.0 /100 | #321 | Tragic $83,319 |
| Dominicans | 0.0 /100 | #322 | Tragic $82,888 |
| Bahamians | 0.0 /100 | #323 | Tragic $82,631 |
| Creek | 0.0 /100 | #324 | Tragic $82,560 |
Demographics Similar to Ethiopians by Median Family Income
In terms of median family income, the demographic groups most similar to Ethiopians are Sri Lankan ($108,234, a difference of 0.020%), Immigrants from Philippines ($108,288, a difference of 0.030%), Immigrants from Northern Africa ($108,161, a difference of 0.080%), European ($108,099, a difference of 0.14%), and Chilean ($108,429, a difference of 0.16%).
| Demographics | Rating | Rank | Median Family Income |
| Immigrants | Western Asia | 95.6 /100 | #111 | Exceptional $108,691 |
| Immigrants | Poland | 95.3 /100 | #112 | Exceptional $108,570 |
| Immigrants | Saudi Arabia | 95.2 /100 | #113 | Exceptional $108,544 |
| Poles | 95.2 /100 | #114 | Exceptional $108,507 |
| Swedes | 95.1 /100 | #115 | Exceptional $108,499 |
| Chileans | 95.0 /100 | #116 | Exceptional $108,429 |
| Immigrants | Philippines | 94.6 /100 | #117 | Exceptional $108,288 |
| Ethiopians | 94.5 /100 | #118 | Exceptional $108,251 |
| Sri Lankans | 94.5 /100 | #119 | Exceptional $108,234 |
| Immigrants | Northern Africa | 94.3 /100 | #120 | Exceptional $108,161 |
| Europeans | 94.1 /100 | #121 | Exceptional $108,099 |
| Immigrants | Jordan | 92.9 /100 | #122 | Exceptional $107,715 |
| Carpatho Rusyns | 92.2 /100 | #123 | Exceptional $107,502 |
| Pakistanis | 91.7 /100 | #124 | Exceptional $107,390 |
| Taiwanese | 91.4 /100 | #125 | Exceptional $107,295 |