Alsatian vs Ethiopian Median Family Income
COMPARE
Alsatian
Ethiopian
Median Family Income
Median Family Income Comparison
Alsatians
Ethiopians
$103,010
MEDIAN FAMILY INCOME
54.3/ 100
METRIC RATING
171st/ 347
METRIC RANK
$108,251
MEDIAN FAMILY INCOME
94.5/ 100
METRIC RATING
118th/ 347
METRIC RANK
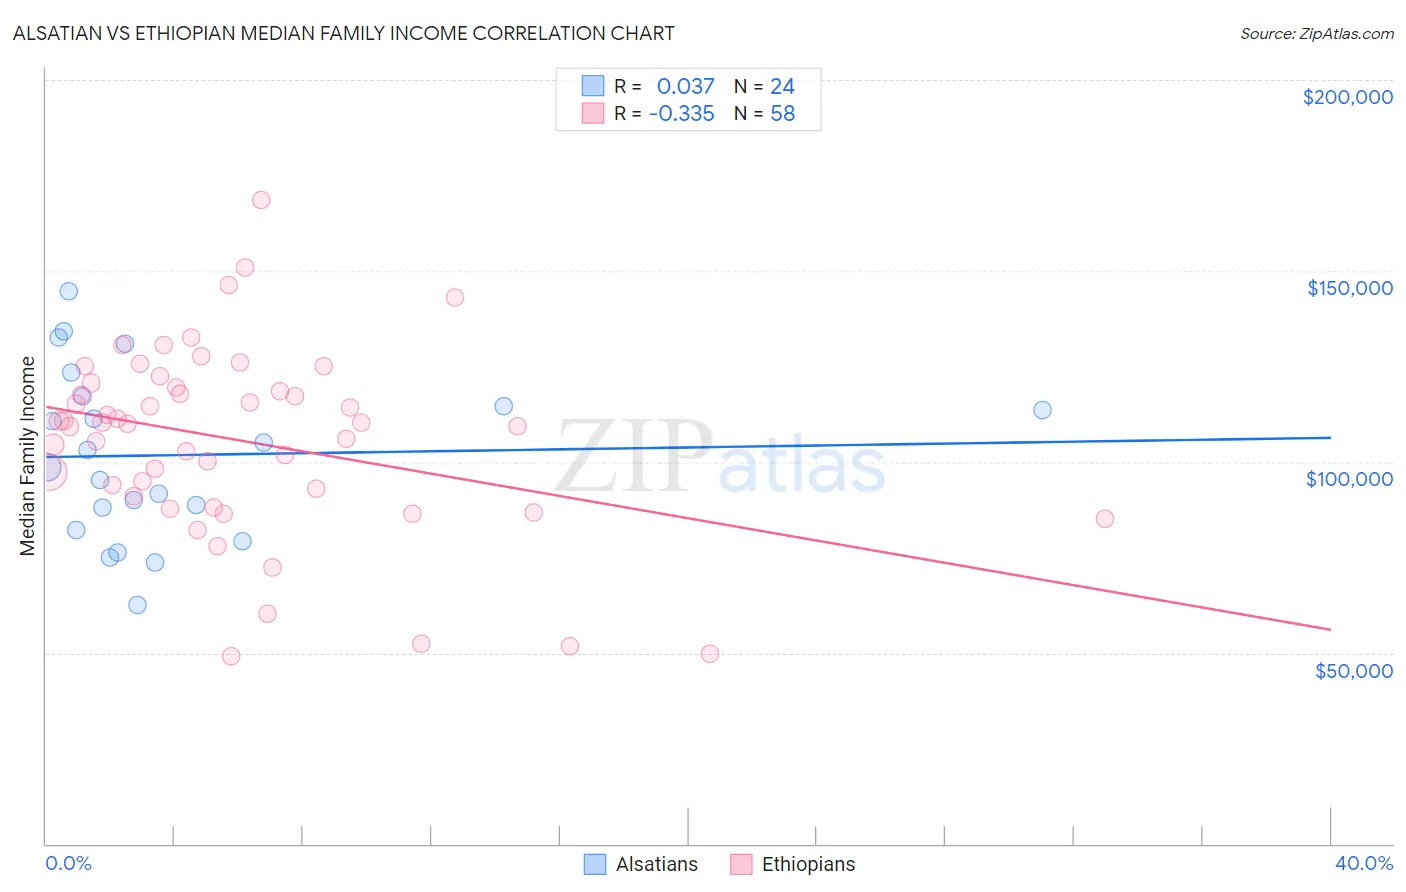
Alsatian vs Ethiopian Median Family Income Correlation Chart
The statistical analysis conducted on geographies consisting of 82,676,924 people shows no correlation between the proportion of Alsatians and median family income in the United States with a correlation coefficient (R) of 0.037 and weighted average of $103,010. Similarly, the statistical analysis conducted on geographies consisting of 223,032,575 people shows a mild negative correlation between the proportion of Ethiopians and median family income in the United States with a correlation coefficient (R) of -0.335 and weighted average of $108,251, a difference of 5.1%.
Median Family Income Correlation Summary
| Measurement | Alsatian | Ethiopian |
| Minimum | $62,500 | $48,964 |
| Maximum | $144,746 | $168,594 |
| Range | $82,246 | $119,630 |
| Mean | $101,763 | $105,611 |
| Median | $100,794 | $110,185 |
| Interquartile 25% (IQ1) | $85,164 | $91,124 |
| Interquartile 75% (IQ3) | $115,830 | $119,625 |
| Interquartile Range (IQR) | $30,667 | $28,501 |
| Standard Deviation (Sample) | $22,004 | $24,590 |
| Standard Deviation (Population) | $21,541 | $24,377 |
Similar Demographics by Median Family Income
Demographics Similar to Alsatians by Median Family Income
In terms of median family income, the demographic groups most similar to Alsatians are Immigrants from Uzbekistan ($103,197, a difference of 0.18%), Immigrants from Eritrea ($102,823, a difference of 0.18%), Belgian ($102,788, a difference of 0.22%), Czechoslovakian ($103,273, a difference of 0.26%), and Finnish ($102,676, a difference of 0.33%).
| Demographics | Rating | Rank | Median Family Income |
| Sierra Leoneans | 64.7 /100 | #164 | Good $103,859 |
| Slovaks | 63.1 /100 | #165 | Good $103,729 |
| English | 62.6 /100 | #166 | Good $103,684 |
| South American Indians | 61.9 /100 | #167 | Good $103,624 |
| Immigrants | Peru | 60.8 /100 | #168 | Good $103,534 |
| Czechoslovakians | 57.6 /100 | #169 | Average $103,273 |
| Immigrants | Uzbekistan | 56.6 /100 | #170 | Average $103,197 |
| Alsatians | 54.3 /100 | #171 | Average $103,010 |
| Immigrants | Eritrea | 51.9 /100 | #172 | Average $102,823 |
| Belgians | 51.4 /100 | #173 | Average $102,788 |
| Finns | 50.0 /100 | #174 | Average $102,676 |
| Immigrants | Eastern Africa | 47.1 /100 | #175 | Average $102,451 |
| French | 46.1 /100 | #176 | Average $102,368 |
| Germans | 44.6 /100 | #177 | Average $102,254 |
| Welsh | 43.3 /100 | #178 | Average $102,151 |
Demographics Similar to Ethiopians by Median Family Income
In terms of median family income, the demographic groups most similar to Ethiopians are Sri Lankan ($108,234, a difference of 0.020%), Immigrants from Philippines ($108,288, a difference of 0.030%), Immigrants from Northern Africa ($108,161, a difference of 0.080%), European ($108,099, a difference of 0.14%), and Chilean ($108,429, a difference of 0.16%).
| Demographics | Rating | Rank | Median Family Income |
| Immigrants | Western Asia | 95.6 /100 | #111 | Exceptional $108,691 |
| Immigrants | Poland | 95.3 /100 | #112 | Exceptional $108,570 |
| Immigrants | Saudi Arabia | 95.2 /100 | #113 | Exceptional $108,544 |
| Poles | 95.2 /100 | #114 | Exceptional $108,507 |
| Swedes | 95.1 /100 | #115 | Exceptional $108,499 |
| Chileans | 95.0 /100 | #116 | Exceptional $108,429 |
| Immigrants | Philippines | 94.6 /100 | #117 | Exceptional $108,288 |
| Ethiopians | 94.5 /100 | #118 | Exceptional $108,251 |
| Sri Lankans | 94.5 /100 | #119 | Exceptional $108,234 |
| Immigrants | Northern Africa | 94.3 /100 | #120 | Exceptional $108,161 |
| Europeans | 94.1 /100 | #121 | Exceptional $108,099 |
| Immigrants | Jordan | 92.9 /100 | #122 | Exceptional $107,715 |
| Carpatho Rusyns | 92.2 /100 | #123 | Exceptional $107,502 |
| Pakistanis | 91.7 /100 | #124 | Exceptional $107,390 |
| Taiwanese | 91.4 /100 | #125 | Exceptional $107,295 |