Immigrants from Vietnam vs Ethiopian Median Family Income
COMPARE
Immigrants from Vietnam
Ethiopian
Median Family Income
Median Family Income Comparison
Immigrants from Vietnam
Ethiopians
$106,186
MEDIAN FAMILY INCOME
85.7/ 100
METRIC RATING
138th/ 347
METRIC RANK
$108,251
MEDIAN FAMILY INCOME
94.5/ 100
METRIC RATING
118th/ 347
METRIC RANK
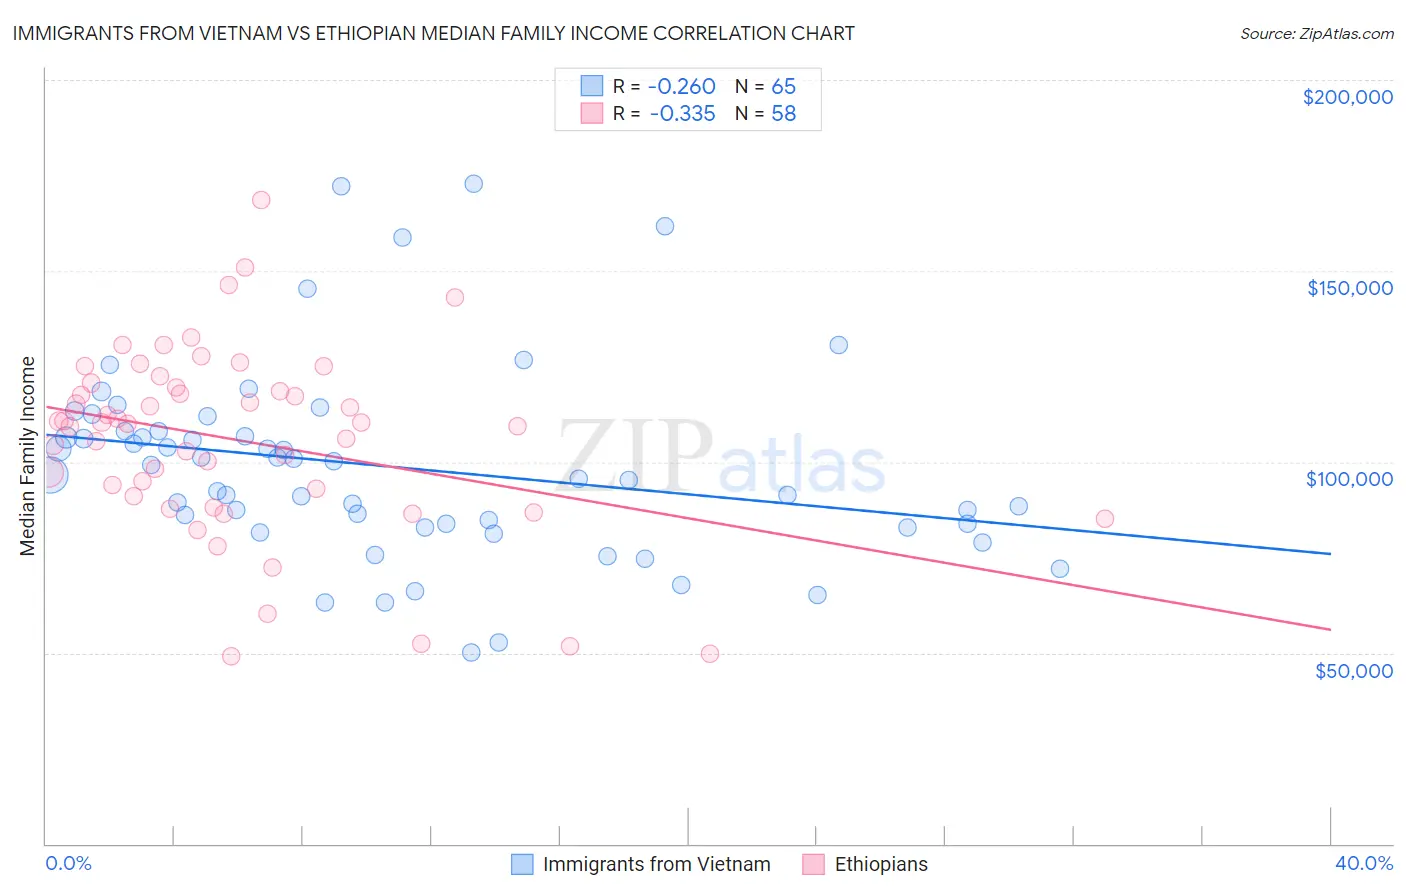
Immigrants from Vietnam vs Ethiopian Median Family Income Correlation Chart
The statistical analysis conducted on geographies consisting of 404,425,840 people shows a weak negative correlation between the proportion of Immigrants from Vietnam and median family income in the United States with a correlation coefficient (R) of -0.260 and weighted average of $106,186. Similarly, the statistical analysis conducted on geographies consisting of 223,032,575 people shows a mild negative correlation between the proportion of Ethiopians and median family income in the United States with a correlation coefficient (R) of -0.335 and weighted average of $108,251, a difference of 1.9%.
Median Family Income Correlation Summary
| Measurement | Immigrants from Vietnam | Ethiopian |
| Minimum | $50,204 | $48,964 |
| Maximum | $172,860 | $168,594 |
| Range | $122,656 | $119,630 |
| Mean | $98,743 | $105,611 |
| Median | $96,507 | $110,185 |
| Interquartile 25% (IQ1) | $83,286 | $91,124 |
| Interquartile 75% (IQ3) | $108,037 | $119,625 |
| Interquartile Range (IQR) | $24,751 | $28,501 |
| Standard Deviation (Sample) | $25,431 | $24,590 |
| Standard Deviation (Population) | $25,234 | $24,377 |
Demographics Similar to Immigrants from Vietnam and Ethiopians by Median Family Income
In terms of median family income, the demographic groups most similar to Immigrants from Vietnam are Immigrants from Uganda ($106,188, a difference of 0.0%), Immigrants from South Eastern Asia ($106,252, a difference of 0.060%), Portuguese ($106,286, a difference of 0.090%), Immigrants from Oceania ($106,453, a difference of 0.25%), and Ugandan ($106,541, a difference of 0.33%). Similarly, the demographic groups most similar to Ethiopians are Sri Lankan ($108,234, a difference of 0.020%), Immigrants from Northern Africa ($108,161, a difference of 0.080%), European ($108,099, a difference of 0.14%), Immigrants from Jordan ($107,715, a difference of 0.50%), and Carpatho Rusyn ($107,502, a difference of 0.70%).
| Demographics | Rating | Rank | Median Family Income |
| Ethiopians | 94.5 /100 | #118 | Exceptional $108,251 |
| Sri Lankans | 94.5 /100 | #119 | Exceptional $108,234 |
| Immigrants | Northern Africa | 94.3 /100 | #120 | Exceptional $108,161 |
| Europeans | 94.1 /100 | #121 | Exceptional $108,099 |
| Immigrants | Jordan | 92.9 /100 | #122 | Exceptional $107,715 |
| Carpatho Rusyns | 92.2 /100 | #123 | Exceptional $107,502 |
| Pakistanis | 91.7 /100 | #124 | Exceptional $107,390 |
| Taiwanese | 91.4 /100 | #125 | Exceptional $107,295 |
| Serbians | 90.8 /100 | #126 | Exceptional $107,157 |
| Lebanese | 90.5 /100 | #127 | Exceptional $107,086 |
| Immigrants | Ethiopia | 90.0 /100 | #128 | Excellent $106,969 |
| Arabs | 89.9 /100 | #129 | Excellent $106,952 |
| Brazilians | 89.8 /100 | #130 | Excellent $106,942 |
| Canadians | 88.1 /100 | #131 | Excellent $106,597 |
| Immigrants | Fiji | 87.8 /100 | #132 | Excellent $106,544 |
| Ugandans | 87.8 /100 | #133 | Excellent $106,541 |
| Immigrants | Oceania | 87.3 /100 | #134 | Excellent $106,453 |
| Portuguese | 86.3 /100 | #135 | Excellent $106,286 |
| Immigrants | South Eastern Asia | 86.1 /100 | #136 | Excellent $106,252 |
| Immigrants | Uganda | 85.7 /100 | #137 | Excellent $106,188 |
| Immigrants | Vietnam | 85.7 /100 | #138 | Excellent $106,186 |