Immigrants from Dominican Republic vs Ethiopian Median Family Income
COMPARE
Immigrants from Dominican Republic
Ethiopian
Median Family Income
Median Family Income Comparison
Immigrants from Dominican Republic
Ethiopians
$81,233
MEDIAN FAMILY INCOME
0.0/ 100
METRIC RATING
331st/ 347
METRIC RANK
$108,251
MEDIAN FAMILY INCOME
94.5/ 100
METRIC RATING
118th/ 347
METRIC RANK
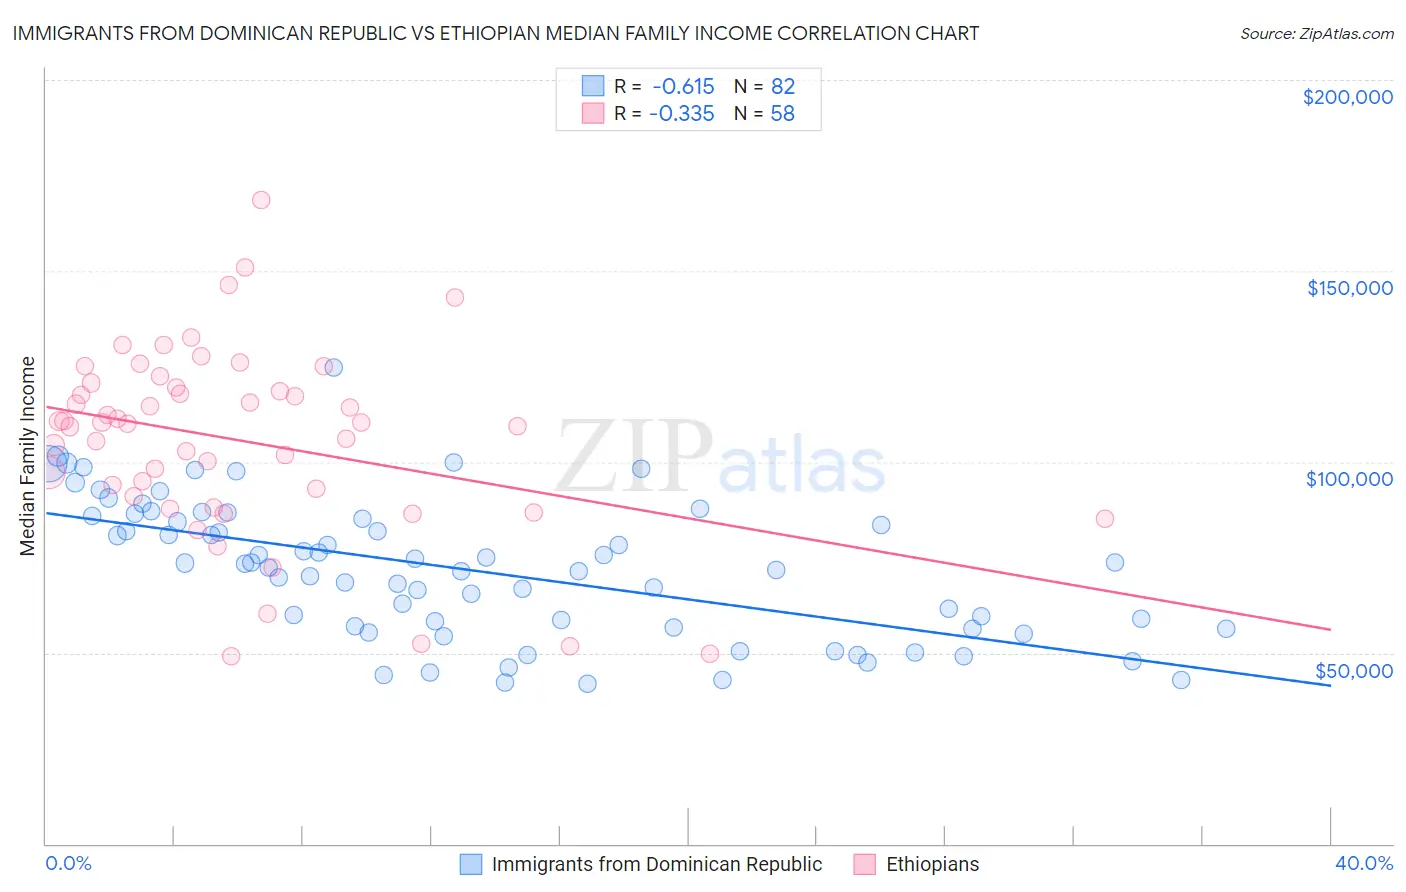
Immigrants from Dominican Republic vs Ethiopian Median Family Income Correlation Chart
The statistical analysis conducted on geographies consisting of 274,877,743 people shows a significant negative correlation between the proportion of Immigrants from Dominican Republic and median family income in the United States with a correlation coefficient (R) of -0.615 and weighted average of $81,233. Similarly, the statistical analysis conducted on geographies consisting of 223,032,575 people shows a mild negative correlation between the proportion of Ethiopians and median family income in the United States with a correlation coefficient (R) of -0.335 and weighted average of $108,251, a difference of 33.3%.
Median Family Income Correlation Summary
| Measurement | Immigrants from Dominican Republic | Ethiopian |
| Minimum | $41,996 | $48,964 |
| Maximum | $124,734 | $168,594 |
| Range | $82,738 | $119,630 |
| Mean | $71,698 | $105,611 |
| Median | $72,932 | $110,185 |
| Interquartile 25% (IQ1) | $56,743 | $91,124 |
| Interquartile 75% (IQ3) | $84,954 | $119,625 |
| Interquartile Range (IQR) | $28,211 | $28,501 |
| Standard Deviation (Sample) | $17,899 | $24,590 |
| Standard Deviation (Population) | $17,789 | $24,377 |
Similar Demographics by Median Family Income
Demographics Similar to Immigrants from Dominican Republic by Median Family Income
In terms of median family income, the demographic groups most similar to Immigrants from Dominican Republic are Cheyenne ($81,385, a difference of 0.19%), Native/Alaskan ($80,908, a difference of 0.40%), Kiowa ($80,885, a difference of 0.43%), Dutch West Indian ($81,852, a difference of 0.76%), and Black/African American ($81,912, a difference of 0.84%).
| Demographics | Rating | Rank | Median Family Income |
| Creek | 0.0 /100 | #324 | Tragic $82,560 |
| Sioux | 0.0 /100 | #325 | Tragic $82,386 |
| Immigrants | Congo | 0.0 /100 | #326 | Tragic $82,216 |
| Arapaho | 0.0 /100 | #327 | Tragic $82,064 |
| Blacks/African Americans | 0.0 /100 | #328 | Tragic $81,912 |
| Dutch West Indians | 0.0 /100 | #329 | Tragic $81,852 |
| Cheyenne | 0.0 /100 | #330 | Tragic $81,385 |
| Immigrants | Dominican Republic | 0.0 /100 | #331 | Tragic $81,233 |
| Natives/Alaskans | 0.0 /100 | #332 | Tragic $80,908 |
| Kiowa | 0.0 /100 | #333 | Tragic $80,885 |
| Menominee | 0.0 /100 | #334 | Tragic $79,563 |
| Yup'ik | 0.0 /100 | #335 | Tragic $79,290 |
| Immigrants | Cuba | 0.0 /100 | #336 | Tragic $78,249 |
| Yuman | 0.0 /100 | #337 | Tragic $78,055 |
| Immigrants | Yemen | 0.0 /100 | #338 | Tragic $77,457 |
Demographics Similar to Ethiopians by Median Family Income
In terms of median family income, the demographic groups most similar to Ethiopians are Sri Lankan ($108,234, a difference of 0.020%), Immigrants from Philippines ($108,288, a difference of 0.030%), Immigrants from Northern Africa ($108,161, a difference of 0.080%), European ($108,099, a difference of 0.14%), and Chilean ($108,429, a difference of 0.16%).
| Demographics | Rating | Rank | Median Family Income |
| Immigrants | Western Asia | 95.6 /100 | #111 | Exceptional $108,691 |
| Immigrants | Poland | 95.3 /100 | #112 | Exceptional $108,570 |
| Immigrants | Saudi Arabia | 95.2 /100 | #113 | Exceptional $108,544 |
| Poles | 95.2 /100 | #114 | Exceptional $108,507 |
| Swedes | 95.1 /100 | #115 | Exceptional $108,499 |
| Chileans | 95.0 /100 | #116 | Exceptional $108,429 |
| Immigrants | Philippines | 94.6 /100 | #117 | Exceptional $108,288 |
| Ethiopians | 94.5 /100 | #118 | Exceptional $108,251 |
| Sri Lankans | 94.5 /100 | #119 | Exceptional $108,234 |
| Immigrants | Northern Africa | 94.3 /100 | #120 | Exceptional $108,161 |
| Europeans | 94.1 /100 | #121 | Exceptional $108,099 |
| Immigrants | Jordan | 92.9 /100 | #122 | Exceptional $107,715 |
| Carpatho Rusyns | 92.2 /100 | #123 | Exceptional $107,502 |
| Pakistanis | 91.7 /100 | #124 | Exceptional $107,390 |
| Taiwanese | 91.4 /100 | #125 | Exceptional $107,295 |