Immigrants from Northern Africa vs Immigrants from Bosnia and Herzegovina Median Household Income
COMPARE
Immigrants from Northern Africa
Immigrants from Bosnia and Herzegovina
Median Household Income
Median Household Income Comparison
Immigrants from Northern Africa
Immigrants from Bosnia and Herzegovina
$90,026
MEDIAN HOUSEHOLD INCOME
95.9/ 100
METRIC RATING
114th/ 347
METRIC RANK
$79,888
MEDIAN HOUSEHOLD INCOME
3.4/ 100
METRIC RATING
236th/ 347
METRIC RANK
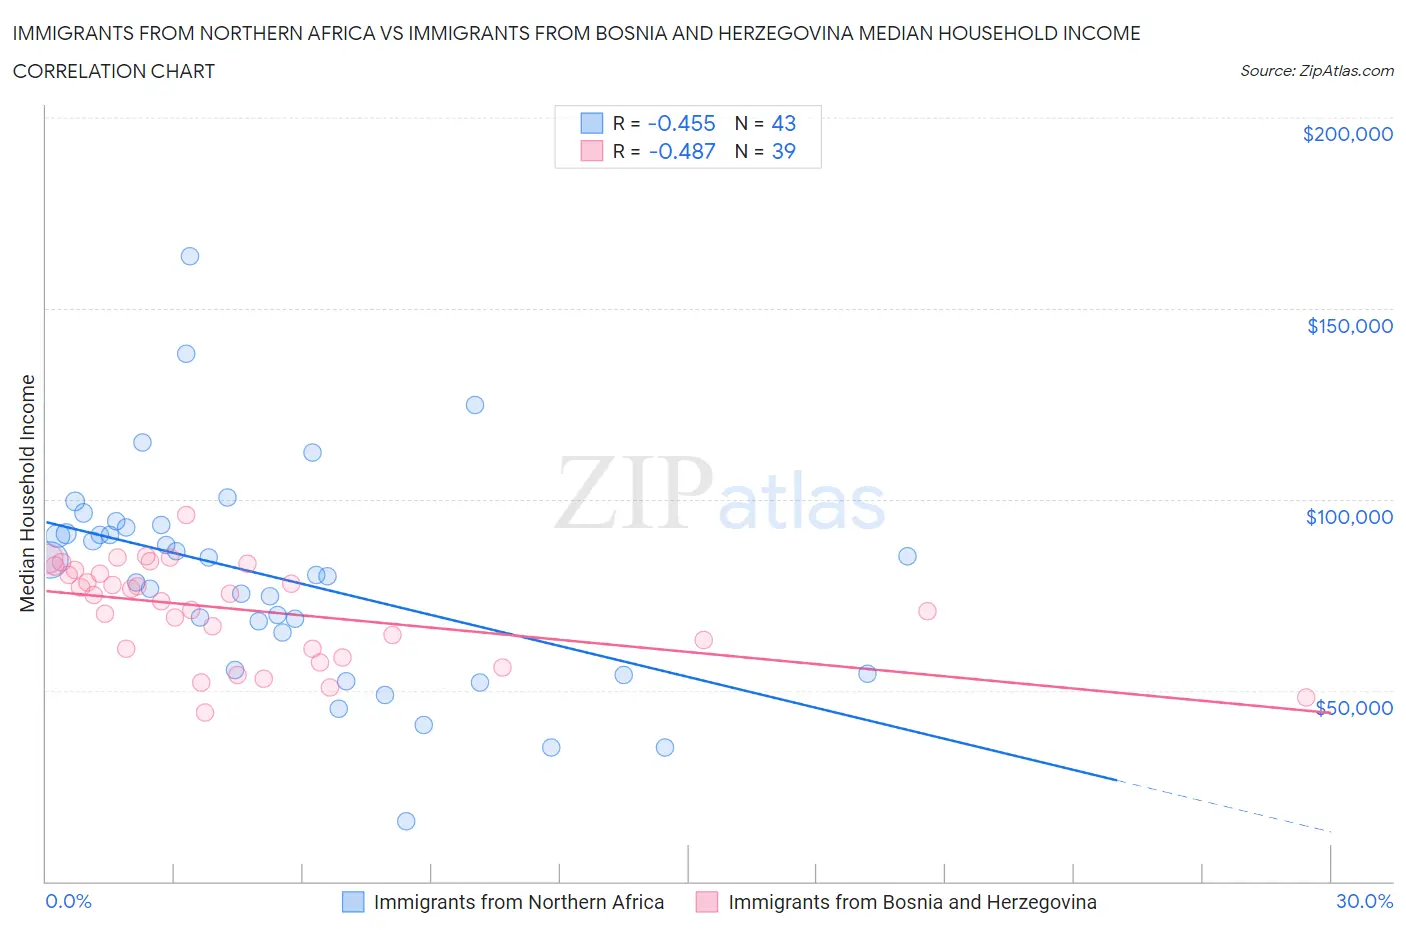
Immigrants from Northern Africa vs Immigrants from Bosnia and Herzegovina Median Household Income Correlation Chart
The statistical analysis conducted on geographies consisting of 321,059,386 people shows a moderate negative correlation between the proportion of Immigrants from Northern Africa and median household income in the United States with a correlation coefficient (R) of -0.455 and weighted average of $90,026. Similarly, the statistical analysis conducted on geographies consisting of 156,785,228 people shows a moderate negative correlation between the proportion of Immigrants from Bosnia and Herzegovina and median household income in the United States with a correlation coefficient (R) of -0.487 and weighted average of $79,888, a difference of 12.7%.
Median Household Income Correlation Summary
| Measurement | Immigrants from Northern Africa | Immigrants from Bosnia and Herzegovina |
| Minimum | $15,682 | $44,295 |
| Maximum | $163,611 | $95,813 |
| Range | $147,929 | $51,518 |
| Mean | $79,183 | $71,018 |
| Median | $80,044 | $74,982 |
| Interquartile 25% (IQ1) | $55,170 | $60,735 |
| Interquartile 75% (IQ3) | $92,628 | $81,375 |
| Interquartile Range (IQR) | $37,458 | $20,640 |
| Standard Deviation (Sample) | $28,084 | $12,624 |
| Standard Deviation (Population) | $27,755 | $12,461 |
Similar Demographics by Median Household Income
Demographics Similar to Immigrants from Northern Africa by Median Household Income
In terms of median household income, the demographic groups most similar to Immigrants from Northern Africa are Immigrants from Western Asia ($90,005, a difference of 0.020%), Native Hawaiian ($89,919, a difference of 0.12%), Taiwanese ($89,900, a difference of 0.14%), Syrian ($89,830, a difference of 0.22%), and Peruvian ($90,261, a difference of 0.26%).
| Demographics | Rating | Rank | Median Household Income |
| Croatians | 97.3 /100 | #107 | Exceptional $90,685 |
| Zimbabweans | 97.2 /100 | #108 | Exceptional $90,618 |
| Chileans | 97.2 /100 | #109 | Exceptional $90,605 |
| Palestinians | 97.1 /100 | #110 | Exceptional $90,574 |
| Immigrants | Poland | 97.1 /100 | #111 | Exceptional $90,549 |
| Northern Europeans | 96.9 /100 | #112 | Exceptional $90,446 |
| Peruvians | 96.5 /100 | #113 | Exceptional $90,261 |
| Immigrants | Northern Africa | 95.9 /100 | #114 | Exceptional $90,026 |
| Immigrants | Western Asia | 95.9 /100 | #115 | Exceptional $90,005 |
| Native Hawaiians | 95.7 /100 | #116 | Exceptional $89,919 |
| Taiwanese | 95.6 /100 | #117 | Exceptional $89,900 |
| Syrians | 95.4 /100 | #118 | Exceptional $89,830 |
| Albanians | 95.2 /100 | #119 | Exceptional $89,744 |
| Immigrants | North Macedonia | 95.2 /100 | #120 | Exceptional $89,741 |
| Ethiopians | 94.9 /100 | #121 | Exceptional $89,640 |
Demographics Similar to Immigrants from Bosnia and Herzegovina by Median Household Income
In terms of median household income, the demographic groups most similar to Immigrants from Bosnia and Herzegovina are Nicaraguan ($79,737, a difference of 0.19%), Barbadian ($79,664, a difference of 0.28%), Alaska Native ($79,509, a difference of 0.48%), Immigrants from Western Africa ($79,490, a difference of 0.50%), and Immigrants from Guyana ($80,324, a difference of 0.55%).
| Demographics | Rating | Rank | Median Household Income |
| Delaware | 5.0 /100 | #229 | Tragic $80,527 |
| Bermudans | 4.7 /100 | #230 | Tragic $80,406 |
| Trinidadians and Tobagonians | 4.7 /100 | #231 | Tragic $80,402 |
| Immigrants | Trinidad and Tobago | 4.6 /100 | #232 | Tragic $80,373 |
| Immigrants | Azores | 4.5 /100 | #233 | Tragic $80,357 |
| Immigrants | Ecuador | 4.5 /100 | #234 | Tragic $80,341 |
| Immigrants | Guyana | 4.5 /100 | #235 | Tragic $80,324 |
| Immigrants | Bosnia and Herzegovina | 3.4 /100 | #236 | Tragic $79,888 |
| Nicaraguans | 3.1 /100 | #237 | Tragic $79,737 |
| Barbadians | 3.0 /100 | #238 | Tragic $79,664 |
| Alaska Natives | 2.7 /100 | #239 | Tragic $79,509 |
| Immigrants | Western Africa | 2.7 /100 | #240 | Tragic $79,490 |
| Immigrants | Nonimmigrants | 2.6 /100 | #241 | Tragic $79,429 |
| Immigrants | Sudan | 2.1 /100 | #242 | Tragic $79,103 |
| Immigrants | Barbados | 1.9 /100 | #243 | Tragic $78,989 |