Belizean vs Immigrants from Bosnia and Herzegovina Median Household Income
COMPARE
Belizean
Immigrants from Bosnia and Herzegovina
Median Household Income
Median Household Income Comparison
Belizeans
Immigrants from Bosnia and Herzegovina
$77,028
MEDIAN HOUSEHOLD INCOME
0.6/ 100
METRIC RATING
256th/ 347
METRIC RANK
$79,888
MEDIAN HOUSEHOLD INCOME
3.4/ 100
METRIC RATING
236th/ 347
METRIC RANK
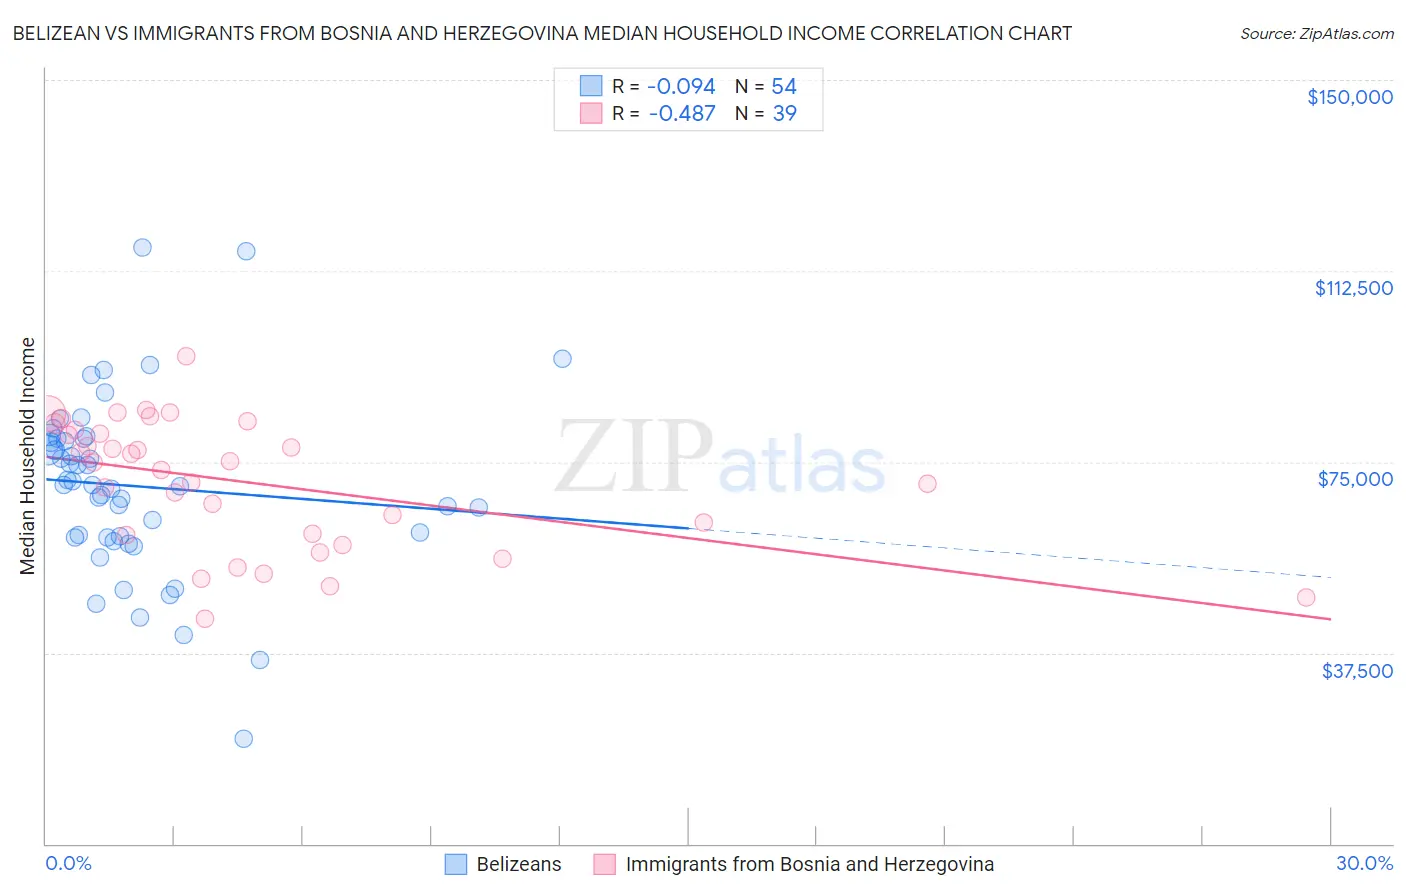
Belizean vs Immigrants from Bosnia and Herzegovina Median Household Income Correlation Chart
The statistical analysis conducted on geographies consisting of 144,146,880 people shows a slight negative correlation between the proportion of Belizeans and median household income in the United States with a correlation coefficient (R) of -0.094 and weighted average of $77,028. Similarly, the statistical analysis conducted on geographies consisting of 156,785,228 people shows a moderate negative correlation between the proportion of Immigrants from Bosnia and Herzegovina and median household income in the United States with a correlation coefficient (R) of -0.487 and weighted average of $79,888, a difference of 3.7%.
Median Household Income Correlation Summary
| Measurement | Belizean | Immigrants from Bosnia and Herzegovina |
| Minimum | $20,723 | $44,295 |
| Maximum | $117,113 | $95,813 |
| Range | $96,390 | $51,518 |
| Mean | $70,224 | $71,018 |
| Median | $70,434 | $74,982 |
| Interquartile 25% (IQ1) | $60,138 | $60,735 |
| Interquartile 75% (IQ3) | $79,527 | $81,375 |
| Interquartile Range (IQR) | $19,389 | $20,640 |
| Standard Deviation (Sample) | $17,495 | $12,624 |
| Standard Deviation (Population) | $17,332 | $12,461 |
Demographics Similar to Belizeans and Immigrants from Bosnia and Herzegovina by Median Household Income
In terms of median household income, the demographic groups most similar to Belizeans are Immigrants from Middle Africa ($77,559, a difference of 0.69%), Subsaharan African ($77,631, a difference of 0.78%), Immigrants from St. Vincent and the Grenadines ($77,690, a difference of 0.86%), Immigrants from West Indies ($77,956, a difference of 1.2%), and Mexican American Indian ($78,166, a difference of 1.5%). Similarly, the demographic groups most similar to Immigrants from Bosnia and Herzegovina are Nicaraguan ($79,737, a difference of 0.19%), Barbadian ($79,664, a difference of 0.28%), Alaska Native ($79,509, a difference of 0.48%), Immigrants from Western Africa ($79,490, a difference of 0.50%), and Nonimmigrants ($79,429, a difference of 0.58%).
| Demographics | Rating | Rank | Median Household Income |
| Immigrants | Bosnia and Herzegovina | 3.4 /100 | #236 | Tragic $79,888 |
| Nicaraguans | 3.1 /100 | #237 | Tragic $79,737 |
| Barbadians | 3.0 /100 | #238 | Tragic $79,664 |
| Alaska Natives | 2.7 /100 | #239 | Tragic $79,509 |
| Immigrants | Western Africa | 2.7 /100 | #240 | Tragic $79,490 |
| Immigrants | Nonimmigrants | 2.6 /100 | #241 | Tragic $79,429 |
| Immigrants | Sudan | 2.1 /100 | #242 | Tragic $79,103 |
| Immigrants | Barbados | 1.9 /100 | #243 | Tragic $78,989 |
| Marshallese | 1.9 /100 | #244 | Tragic $78,930 |
| Inupiat | 1.8 /100 | #245 | Tragic $78,841 |
| Central Americans | 1.7 /100 | #246 | Tragic $78,803 |
| Immigrants | Burma/Myanmar | 1.6 /100 | #247 | Tragic $78,682 |
| Sudanese | 1.5 /100 | #248 | Tragic $78,529 |
| West Indians | 1.4 /100 | #249 | Tragic $78,455 |
| Immigrants | Laos | 1.3 /100 | #250 | Tragic $78,327 |
| Mexican American Indians | 1.2 /100 | #251 | Tragic $78,166 |
| Immigrants | West Indies | 1.0 /100 | #252 | Tragic $77,956 |
| Immigrants | St. Vincent and the Grenadines | 0.9 /100 | #253 | Tragic $77,690 |
| Sub-Saharan Africans | 0.8 /100 | #254 | Tragic $77,631 |
| Immigrants | Middle Africa | 0.8 /100 | #255 | Tragic $77,559 |
| Belizeans | 0.6 /100 | #256 | Tragic $77,028 |