West Indian vs Immigrants from Costa Rica Median Earnings
COMPARE
West Indian
Immigrants from Costa Rica
Median Earnings
Median Earnings Comparison
West Indians
Immigrants from Costa Rica
$45,132
MEDIAN EARNINGS
13.9/ 100
METRIC RATING
224th/ 347
METRIC RANK
$45,928
MEDIAN EARNINGS
33.0/ 100
METRIC RATING
194th/ 347
METRIC RANK
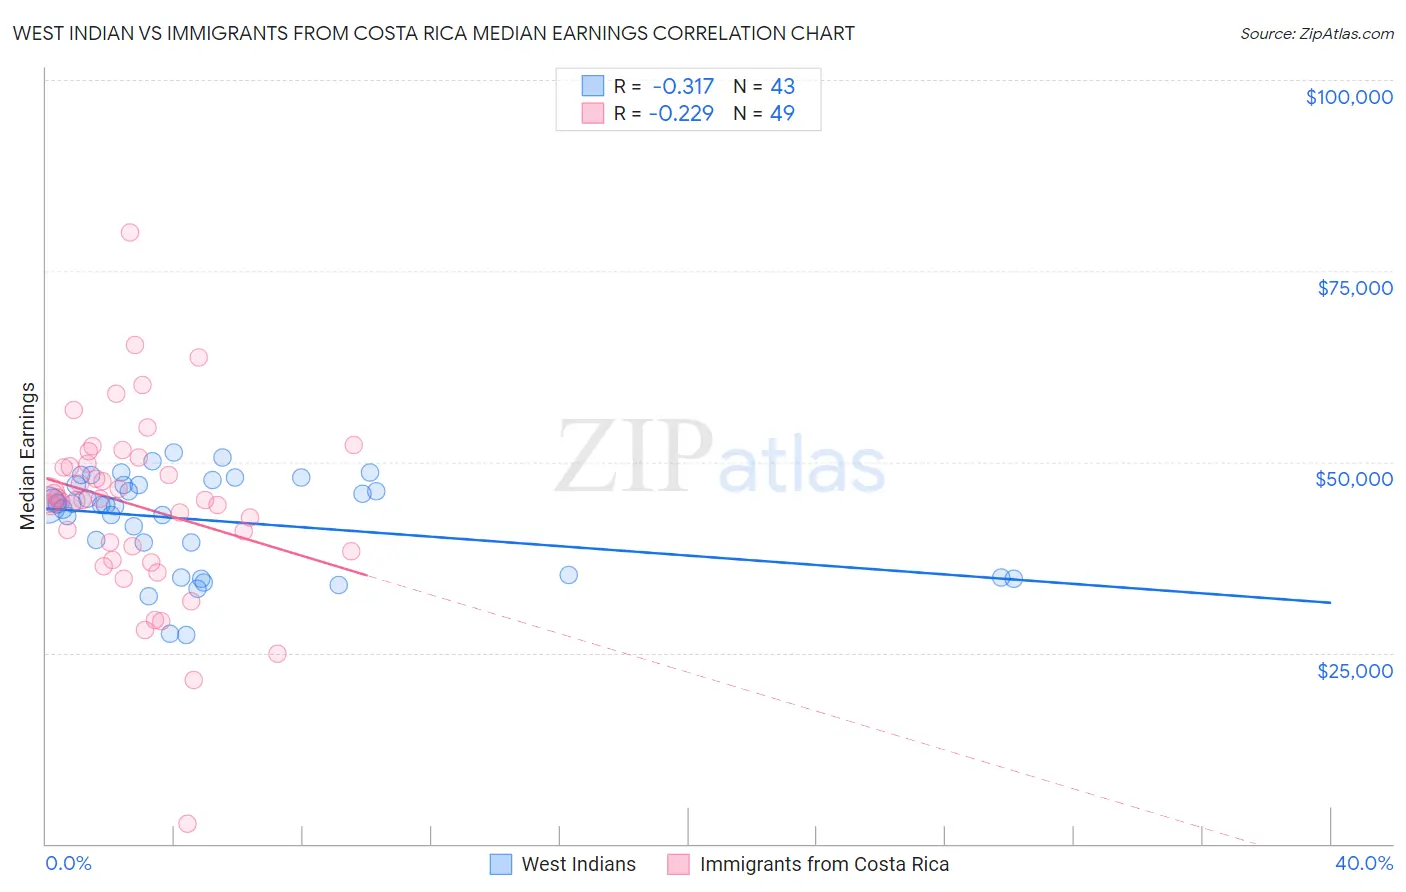
West Indian vs Immigrants from Costa Rica Median Earnings Correlation Chart
The statistical analysis conducted on geographies consisting of 254,045,468 people shows a mild negative correlation between the proportion of West Indians and median earnings in the United States with a correlation coefficient (R) of -0.317 and weighted average of $45,132. Similarly, the statistical analysis conducted on geographies consisting of 204,262,782 people shows a weak negative correlation between the proportion of Immigrants from Costa Rica and median earnings in the United States with a correlation coefficient (R) of -0.229 and weighted average of $45,928, a difference of 1.8%.
Median Earnings Correlation Summary
| Measurement | West Indian | Immigrants from Costa Rica |
| Minimum | $27,409 | $2,615 |
| Maximum | $51,215 | $80,083 |
| Range | $23,806 | $77,468 |
| Mean | $42,337 | $44,180 |
| Median | $44,343 | $45,027 |
| Interquartile 25% (IQ1) | $35,256 | $37,709 |
| Interquartile 75% (IQ3) | $47,046 | $50,100 |
| Interquartile Range (IQR) | $11,790 | $12,390 |
| Standard Deviation (Sample) | $6,289 | $12,240 |
| Standard Deviation (Population) | $6,215 | $12,114 |
Similar Demographics by Median Earnings
Demographics Similar to West Indians by Median Earnings
In terms of median earnings, the demographic groups most similar to West Indians are Immigrants from Cambodia ($45,090, a difference of 0.090%), Immigrants from Panama ($45,198, a difference of 0.15%), White/Caucasian ($45,197, a difference of 0.15%), Immigrants from Guyana ($45,204, a difference of 0.16%), and Ecuadorian ($45,214, a difference of 0.18%).
| Demographics | Rating | Rank | Median Earnings |
| Tlingit-Haida | 20.5 /100 | #217 | Fair $45,468 |
| Spanish | 19.7 /100 | #218 | Poor $45,432 |
| Dutch | 18.4 /100 | #219 | Poor $45,370 |
| Ecuadorians | 15.3 /100 | #220 | Poor $45,214 |
| Immigrants | Guyana | 15.1 /100 | #221 | Poor $45,204 |
| Immigrants | Panama | 15.0 /100 | #222 | Poor $45,198 |
| Whites/Caucasians | 15.0 /100 | #223 | Poor $45,197 |
| West Indians | 13.9 /100 | #224 | Poor $45,132 |
| Immigrants | Cambodia | 13.2 /100 | #225 | Poor $45,090 |
| Immigrants | Nigeria | 12.2 /100 | #226 | Poor $45,030 |
| Native Hawaiians | 12.2 /100 | #227 | Poor $45,027 |
| Immigrants | Iraq | 11.6 /100 | #228 | Poor $44,988 |
| Scotch-Irish | 10.7 /100 | #229 | Poor $44,924 |
| Immigrants | Western Africa | 10.3 /100 | #230 | Poor $44,893 |
| Japanese | 9.5 /100 | #231 | Tragic $44,825 |
Demographics Similar to Immigrants from Costa Rica by Median Earnings
In terms of median earnings, the demographic groups most similar to Immigrants from Costa Rica are Guamanian/Chamorro ($45,933, a difference of 0.010%), German ($45,935, a difference of 0.020%), Finnish ($45,940, a difference of 0.030%), Immigrants from St. Vincent and the Grenadines ($45,908, a difference of 0.040%), and Yugoslavian ($45,846, a difference of 0.18%).
| Demographics | Rating | Rank | Median Earnings |
| Iraqis | 39.9 /100 | #187 | Fair $46,140 |
| Immigrants | Armenia | 38.3 /100 | #188 | Fair $46,094 |
| Spaniards | 37.2 /100 | #189 | Fair $46,059 |
| French Canadians | 36.1 /100 | #190 | Fair $46,026 |
| Finns | 33.4 /100 | #191 | Fair $45,940 |
| Germans | 33.2 /100 | #192 | Fair $45,935 |
| Guamanians/Chamorros | 33.2 /100 | #193 | Fair $45,933 |
| Immigrants | Costa Rica | 33.0 /100 | #194 | Fair $45,928 |
| Immigrants | St. Vincent and the Grenadines | 32.4 /100 | #195 | Fair $45,908 |
| Yugoslavians | 30.5 /100 | #196 | Fair $45,846 |
| Barbadians | 30.5 /100 | #197 | Fair $45,846 |
| Trinidadians and Tobagonians | 29.7 /100 | #198 | Fair $45,820 |
| Immigrants | Barbados | 29.6 /100 | #199 | Fair $45,816 |
| Immigrants | Azores | 29.5 /100 | #200 | Fair $45,812 |
| Celtics | 27.2 /100 | #201 | Fair $45,732 |