Welsh vs Immigrants from Indonesia Householder Income Ages 45 - 64 years
COMPARE
Welsh
Immigrants from Indonesia
Householder Income Ages 45 - 64 years
Householder Income Ages 45 - 64 years Comparison
Welsh
Immigrants from Indonesia
$100,322
HOUSEHOLDER INCOME AGES 45 - 64 YEARS
50.0/ 100
METRIC RATING
174th/ 347
METRIC RANK
$113,519
HOUSEHOLDER INCOME AGES 45 - 64 YEARS
99.9/ 100
METRIC RATING
48th/ 347
METRIC RANK
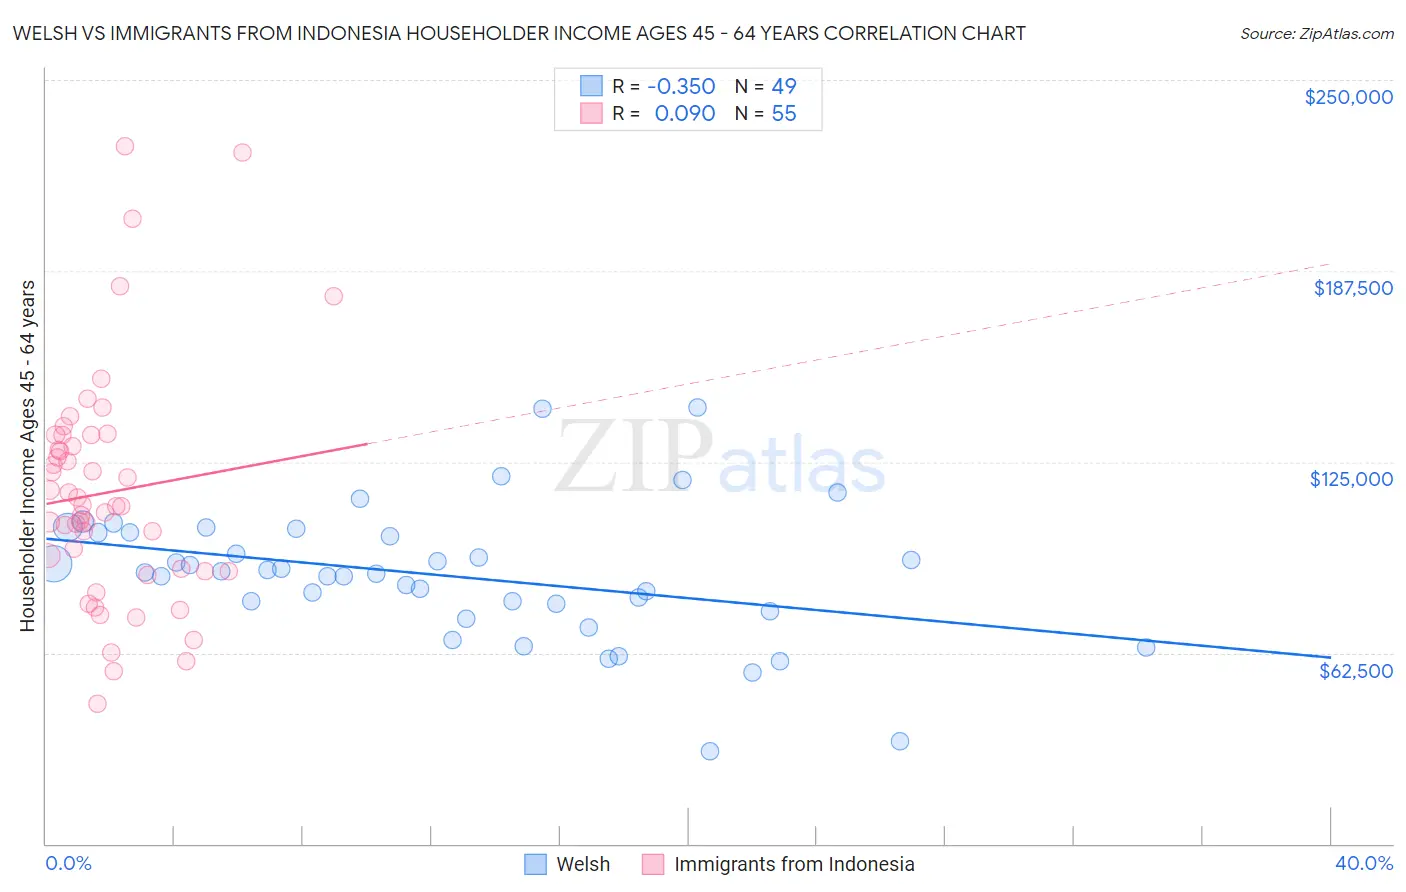
Welsh vs Immigrants from Indonesia Householder Income Ages 45 - 64 years Correlation Chart
The statistical analysis conducted on geographies consisting of 526,360,358 people shows a mild negative correlation between the proportion of Welsh and household income with householder between the ages 45 and 64 in the United States with a correlation coefficient (R) of -0.350 and weighted average of $100,322. Similarly, the statistical analysis conducted on geographies consisting of 215,592,111 people shows a slight positive correlation between the proportion of Immigrants from Indonesia and household income with householder between the ages 45 and 64 in the United States with a correlation coefficient (R) of 0.090 and weighted average of $113,519, a difference of 13.2%.
Householder Income Ages 45 - 64 years Correlation Summary
| Measurement | Welsh | Immigrants from Indonesia |
| Minimum | $30,217 | $45,964 |
| Maximum | $142,813 | $228,214 |
| Range | $112,596 | $182,250 |
| Mean | $87,855 | $114,986 |
| Median | $88,674 | $110,532 |
| Interquartile 25% (IQ1) | $77,359 | $89,063 |
| Interquartile 75% (IQ3) | $101,863 | $133,651 |
| Interquartile Range (IQR) | $24,505 | $44,588 |
| Standard Deviation (Sample) | $22,164 | $37,980 |
| Standard Deviation (Population) | $21,937 | $37,633 |
Similar Demographics by Householder Income Ages 45 - 64 years
Demographics Similar to Welsh by Householder Income Ages 45 - 64 years
In terms of householder income ages 45 - 64 years, the demographic groups most similar to Welsh are German ($100,224, a difference of 0.10%), Alsatian ($100,435, a difference of 0.11%), Immigrants from Costa Rica ($100,141, a difference of 0.18%), Moroccan ($100,138, a difference of 0.18%), and Immigrants from Uzbekistan ($100,523, a difference of 0.20%).
| Demographics | Rating | Rank | Householder Income Ages 45 - 64 years |
| Czechoslovakians | 63.0 /100 | #167 | Good $101,387 |
| South American Indians | 60.5 /100 | #168 | Good $101,171 |
| Guamanians/Chamorros | 60.5 /100 | #169 | Good $101,170 |
| Slovaks | 58.8 /100 | #170 | Average $101,029 |
| South Americans | 56.4 /100 | #171 | Average $100,837 |
| Immigrants | Uzbekistan | 52.5 /100 | #172 | Average $100,523 |
| Alsatians | 51.4 /100 | #173 | Average $100,435 |
| Welsh | 50.0 /100 | #174 | Average $100,322 |
| Germans | 48.8 /100 | #175 | Average $100,224 |
| Immigrants | Costa Rica | 47.7 /100 | #176 | Average $100,141 |
| Moroccans | 47.7 /100 | #177 | Average $100,138 |
| Immigrants | Cameroon | 47.0 /100 | #178 | Average $100,084 |
| Belgians | 46.7 /100 | #179 | Average $100,060 |
| Aleuts | 46.6 /100 | #180 | Average $100,052 |
| Immigrants | Immigrants | 45.3 /100 | #181 | Average $99,943 |
Demographics Similar to Immigrants from Indonesia by Householder Income Ages 45 - 64 years
In terms of householder income ages 45 - 64 years, the demographic groups most similar to Immigrants from Indonesia are Australian ($113,533, a difference of 0.010%), Immigrants from Greece ($113,548, a difference of 0.030%), Immigrants from France ($113,680, a difference of 0.14%), Immigrants from Russia ($113,215, a difference of 0.27%), and Bulgarian ($113,883, a difference of 0.32%).
| Demographics | Rating | Rank | Householder Income Ages 45 - 64 years |
| Immigrants | Lithuania | 99.9 /100 | #41 | Exceptional $114,336 |
| Estonians | 99.9 /100 | #42 | Exceptional $114,220 |
| Israelis | 99.9 /100 | #43 | Exceptional $114,186 |
| Bulgarians | 99.9 /100 | #44 | Exceptional $113,883 |
| Immigrants | France | 99.9 /100 | #45 | Exceptional $113,680 |
| Immigrants | Greece | 99.9 /100 | #46 | Exceptional $113,548 |
| Australians | 99.9 /100 | #47 | Exceptional $113,533 |
| Immigrants | Indonesia | 99.9 /100 | #48 | Exceptional $113,519 |
| Immigrants | Russia | 99.8 /100 | #49 | Exceptional $113,215 |
| Immigrants | Austria | 99.8 /100 | #50 | Exceptional $113,140 |
| Immigrants | South Africa | 99.8 /100 | #51 | Exceptional $112,886 |
| Immigrants | Malaysia | 99.8 /100 | #52 | Exceptional $112,796 |
| Afghans | 99.8 /100 | #53 | Exceptional $112,676 |
| Greeks | 99.8 /100 | #54 | Exceptional $112,630 |
| Lithuanians | 99.8 /100 | #55 | Exceptional $112,484 |