Spanish vs Immigrants from Central America Householder Income Ages 25 - 44 years
COMPARE
Spanish
Immigrants from Central America
Householder Income Ages 25 - 44 years
Householder Income Ages 25 - 44 years Comparison
Spanish
Immigrants from Central America
$92,200
HOUSEHOLDER INCOME AGES 25 - 44 YEARS
21.2/ 100
METRIC RATING
197th/ 347
METRIC RANK
$80,012
HOUSEHOLDER INCOME AGES 25 - 44 YEARS
0.0/ 100
METRIC RATING
308th/ 347
METRIC RANK
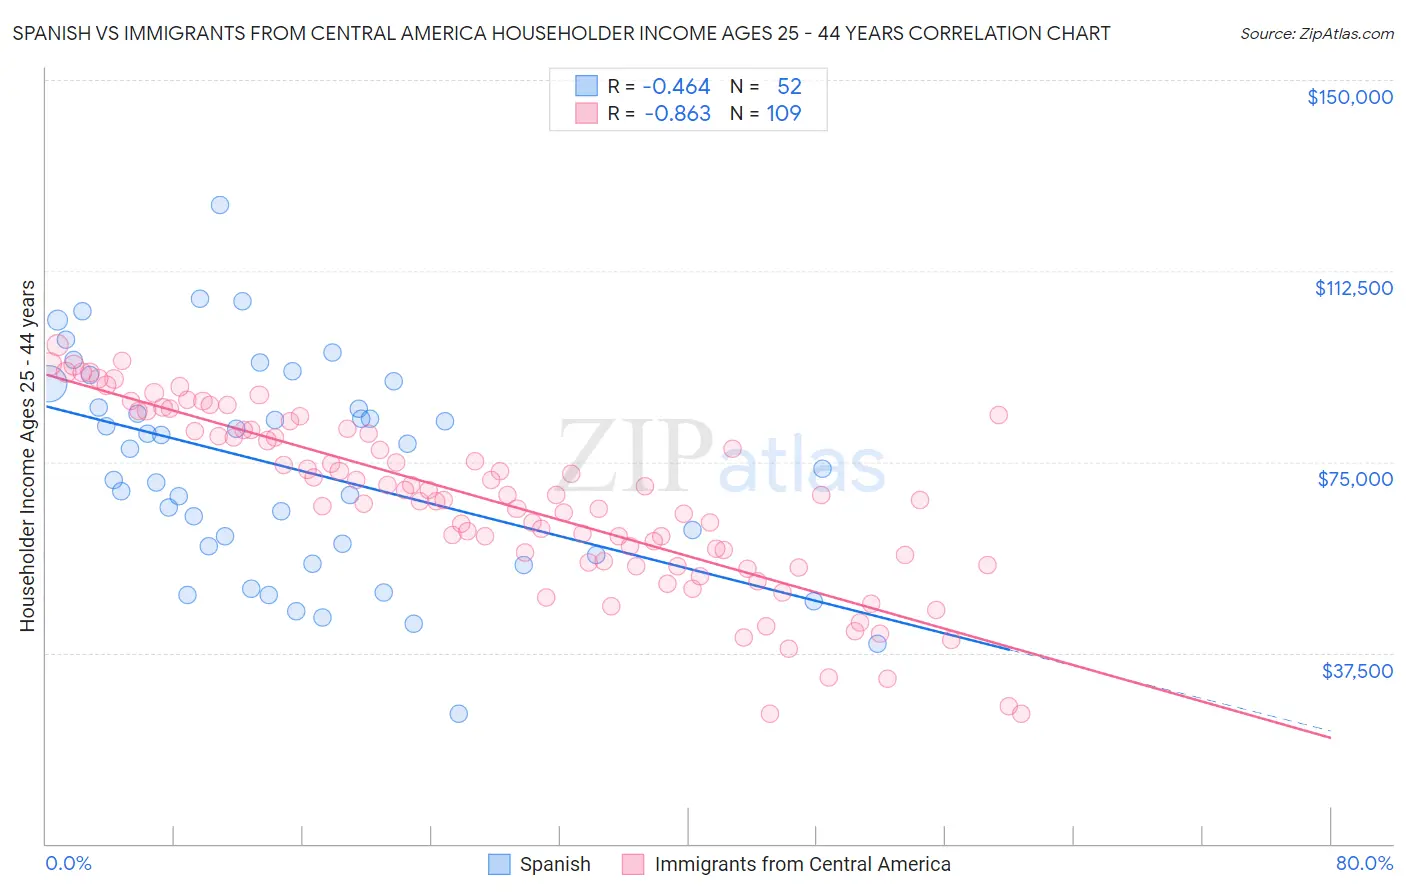
Spanish vs Immigrants from Central America Householder Income Ages 25 - 44 years Correlation Chart
The statistical analysis conducted on geographies consisting of 420,641,829 people shows a moderate negative correlation between the proportion of Spanish and household income with householder between the ages 25 and 44 in the United States with a correlation coefficient (R) of -0.464 and weighted average of $92,200. Similarly, the statistical analysis conducted on geographies consisting of 532,829,838 people shows a very strong negative correlation between the proportion of Immigrants from Central America and household income with householder between the ages 25 and 44 in the United States with a correlation coefficient (R) of -0.863 and weighted average of $80,012, a difference of 15.2%.
Householder Income Ages 25 - 44 years Correlation Summary
| Measurement | Spanish | Immigrants from Central America |
| Minimum | $25,625 | $25,500 |
| Maximum | $125,388 | $97,900 |
| Range | $99,763 | $72,400 |
| Mean | $73,721 | $67,406 |
| Median | $75,712 | $68,457 |
| Interquartile 25% (IQ1) | $57,541 | $55,448 |
| Interquartile 75% (IQ3) | $88,040 | $81,287 |
| Interquartile Range (IQR) | $30,499 | $25,840 |
| Standard Deviation (Sample) | $20,894 | $17,129 |
| Standard Deviation (Population) | $20,692 | $17,050 |
Similar Demographics by Householder Income Ages 25 - 44 years
Demographics Similar to Spanish by Householder Income Ages 25 - 44 years
In terms of householder income ages 25 - 44 years, the demographic groups most similar to Spanish are Immigrants from Colombia ($92,204, a difference of 0.0%), Celtic ($92,241, a difference of 0.040%), Vietnamese ($92,089, a difference of 0.12%), Immigrants from the Azores ($92,322, a difference of 0.13%), and Samoan ($92,385, a difference of 0.20%).
| Demographics | Rating | Rank | Householder Income Ages 25 - 44 years |
| Welsh | 30.0 /100 | #190 | Fair $93,039 |
| Tlingit-Haida | 29.4 /100 | #191 | Fair $92,987 |
| Immigrants | Costa Rica | 28.2 /100 | #192 | Fair $92,876 |
| Samoans | 23.0 /100 | #193 | Fair $92,385 |
| Immigrants | Azores | 22.4 /100 | #194 | Fair $92,322 |
| Celtics | 21.6 /100 | #195 | Fair $92,241 |
| Immigrants | Colombia | 21.3 /100 | #196 | Fair $92,204 |
| Spanish | 21.2 /100 | #197 | Fair $92,200 |
| Vietnamese | 20.2 /100 | #198 | Fair $92,089 |
| Kenyans | 16.8 /100 | #199 | Poor $91,684 |
| Whites/Caucasians | 16.7 /100 | #200 | Poor $91,668 |
| Japanese | 16.4 /100 | #201 | Poor $91,624 |
| Ecuadorians | 16.0 /100 | #202 | Poor $91,574 |
| Immigrants | Cambodia | 15.7 /100 | #203 | Poor $91,533 |
| Nepalese | 15.4 /100 | #204 | Poor $91,498 |
Demographics Similar to Immigrants from Central America by Householder Income Ages 25 - 44 years
In terms of householder income ages 25 - 44 years, the demographic groups most similar to Immigrants from Central America are Chippewa ($80,005, a difference of 0.010%), Haitian ($80,055, a difference of 0.050%), Fijian ($79,956, a difference of 0.070%), Apache ($80,260, a difference of 0.31%), and Immigrants from Dominican Republic ($80,319, a difference of 0.38%).
| Demographics | Rating | Rank | Householder Income Ages 25 - 44 years |
| Immigrants | Micronesia | 0.0 /100 | #301 | Tragic $80,544 |
| Hispanics or Latinos | 0.0 /100 | #302 | Tragic $80,515 |
| Mexicans | 0.0 /100 | #303 | Tragic $80,427 |
| Immigrants | Caribbean | 0.0 /100 | #304 | Tragic $80,326 |
| Immigrants | Dominican Republic | 0.0 /100 | #305 | Tragic $80,319 |
| Apache | 0.0 /100 | #306 | Tragic $80,260 |
| Haitians | 0.0 /100 | #307 | Tragic $80,055 |
| Immigrants | Central America | 0.0 /100 | #308 | Tragic $80,012 |
| Chippewa | 0.0 /100 | #309 | Tragic $80,005 |
| Fijians | 0.0 /100 | #310 | Tragic $79,956 |
| Indonesians | 0.0 /100 | #311 | Tragic $79,543 |
| Immigrants | Haiti | 0.0 /100 | #312 | Tragic $79,391 |
| Menominee | 0.0 /100 | #313 | Tragic $79,358 |
| Cheyenne | 0.0 /100 | #314 | Tragic $79,152 |
| Ottawa | 0.0 /100 | #315 | Tragic $79,012 |